When it comes to the stock market, investors are constantly on the prowl for the next profitable win. However, it’s not always about finding the next hot stock on the ascent. Plenty of the most rewarding investment opportunities often hide in oversold stocks. But what exactly is an oversold stock meaning? Why is it worth considering as part of your investment strategy?
Think of it this way: An oversold stock, like a diamond in the rough, is waiting for astute investors to discover. But, much like mining for diamonds, it requires a keen eye and patience to unearth the true worth of an oversold stock. In this blog post, we will delve into the intricacies of oversold stocks. Here, you can learn the various indicators used to identify them, the corresponding trading strategies, and the potential rewards and risks. So, if you’re ready to unearth the hidden gems of the stock market, read on!
What does oversold stock mean?
At its core, an oversold stock is meaning that the stock’s decline exceeds normal levels. The current price may be even lower than its intrinsic value. Various reasons could lead to this situation, such as a short-term company performance downturn, a bearish market trend, or even a temporary interest loss from investors. But regardless of the cause, an oversold stock may present a prime opportunity for investors. To grasp this opportunity, you must be willing to do your due diligence, look beyond short-term fluctuations, and see the bigger picture.
An interesting example of an oversold stock is the story of Amazon.com in the early 2000s. At the time, the dot-com bubble had burst. Numerous investors were writing off internet-based companies as a lost cause. But those who took a closer look at Amazon’s fundamentals realized that the company was still very much on solid footing. The company has a loyal customer base and a robust business model. Despite the panic market sentiment pushing the stock price to seemingly “oversold” levels, those who invested in Amazon during this period reaped significant returns as the company’s fortunes turned around.
Technical indicators used to identify oversold stocks
Technical indicators play a crucial role in identifying oversold stocks. These indicators are mathematical calculations based on a stock’s price and/or volume. Technical analysts use them to discern patterns and trends that may not be immediately apparent from the candlestick charts. Here are some commonly used technical indicators for identifying oversold stocks:
Use RSI to identify oversold stocks
The Relative Strength Index (RSI) is a specialized technical indicator for identifying oversold stocks. It is a momentum indicator that compares the magnitude of a stock’s gains to its losses in a recent period, typically 14 days. The RSI ranges between 0 and 100. The higher the RSI value, the stronger the bullish momentum of the stock. Conversely, the lower the RSI value, the stronger the bearish momentum.
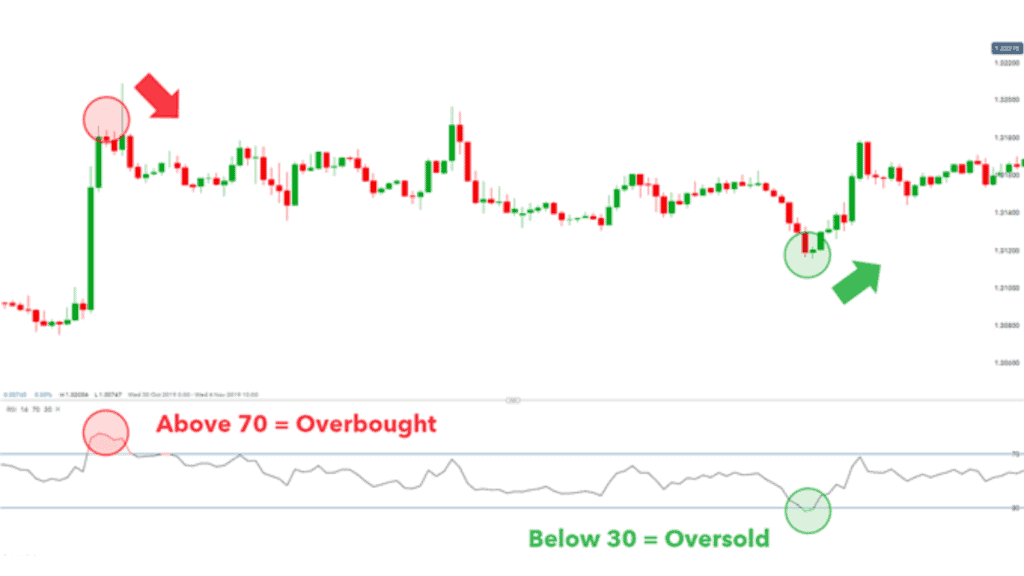
When the RSI falls below 30, it indicates that the stock may have recently dropped too much. The current price may have deviated from the fundamentals. Therefore it is a good buying opportunity.
It’s worth mentioning that oversold conditions can be long-lived, and stocks may not rebound immediately. It’s essential to be patient and not to make hasty decisions based on a single indicator. Instead, investors should use RSI as a starting point for further research and analysis.
Use MACD to identify oversold stocks
Some investors use Moving Average Convergence Divergence (MACD) to identify oversold stocks. MACD indicator compares the difference between short-term and long-term moving averages.
To use the MACD indicator to identify oversold stocks, one should first plot the indicator on a stock chart. You can make it by adding the MACD indicator to the chart and adjusting the settings to the desired parameters (Most brokerages and charting platforms support this function). A standard setting is to use a 12-period moving average as the fast line and a 26-period moving average as the slow line, with a 9-period moving average as the signal line.

Once the plot is complete, traders should look for instances where the MACD line crosses below the signal line. This is known as a bearish crossover. You can roughly observe the decline rate of the MACD line around the crossover. If the rate of decline is steep, it may be a sign that the stock has become oversold. You should also pay attention to the histogram, which is the difference between the MACD and signal lines. When the histogram is negative and declining further quickly, it can imply an oversold.
It’s worth noting that the MACD indicator works better in trending markets than in sideways or choppy markets. Before using MACD to determine oversold, it is best first to assess the current market situation.
Use Bollinger Bands to identify oversold stocks
Many investors do not know they can also use Bollinger Bands to determine overbought or oversold. The bands are plotted two standard deviations away from a simple moving average, typically of 20 days. Thus, Bollinger Bands serve as a volatility indicator in most cases.
The idea behind the Bollinger Band is that prices tend to stay within the band. Therefore, if the price fluctuates dramatically and runs outside the bands, there might be an unusual trading signal.
Bollinger Bands are not outstanding when viewed as a single indicator. Using it with other technical and fundamental analyses would be better.
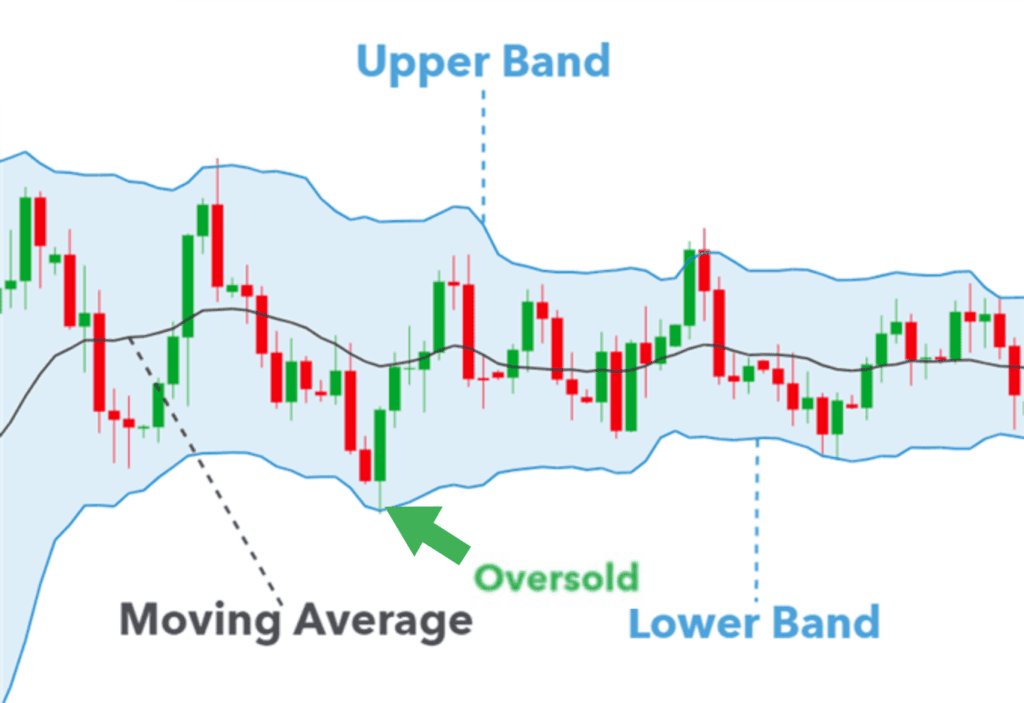
One way to use Bollinger Bands to identify oversold stocks is to look for those that have recently touched or breached the lower band. Then check whether there are bullish signals, such as a positive moving average crossover or a bullish divergence between the stock’s price and a momentum indicator.
Also, you can pay attention to stocks consistently trading within the lower band for an extended period. A persistent state of oversold conditions might exist there. This could signify that the stock is undervalued and may be ready for a rebound.
Identify oversold stocks by fundamental analysis
Besides technical indicators, fundamental analysis is also suitable for determining if a stock is oversold. One unique way to check oversold from fundamental aspects is by evaluating its P/E ratio. A P/E ratio, or price-to-earnings ratio, is a financial metric that compares a stock’s market price to its earnings per share.
To determine oversold conditions, you can compare a specific stock’s P/E ratio to the overall industry. For instance, suppose the average P/E ratio for the sector in S&P 500 is 15. But if a particular stock has a P/E ratio of 10, it may be oversold and undervalued. Conversely, a 20 P/E ratio may imply overvalued.
Please note you need to compare it to a specific industry rather than the whole S&P 500. P/E ratios can vary significantly among industries. For example, the technology industry will have a higher P/E ratio than the energy industry.
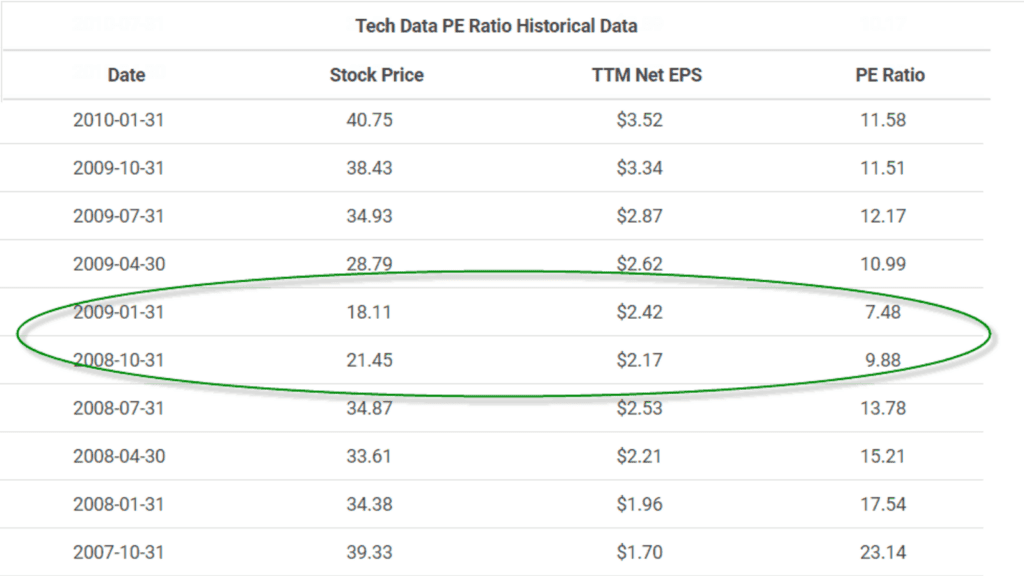
You can also use the P/E ratio to check oversold by comparing it to the company’s historical P/E ratios. Take a closer look at the company if its current P/E ratio is significantly lower than its historical average. It may be an oversold stock, but you need to confirm. There may be justified reasons for a decrease in a company’s valuation. Sometimes, a company is indeed on a downward trend, or the industry in which the company operates has become obsolete.
Please do not rely solely on the P/E ratio to determine if there is an overbought or oversold. A stock’s P/E ratio is sensitive to the overall market conditions. Oversold is common during a recession due to investors’ risk-averse behavior. In such cases, a low P/E ratio may not necessarily mean that the stock is undervalued but that the market is uncertain.
Don’t misunderstand the meaning of oversold stock
A common misconception among traders is to regard oversold as a buy signal directly. However, oversold simply indicates that the asset is currently trading significantly lower than it typically does. Although it is tempting to jump in and buy it, purchasing an oversold asset without a deeper investigation is irrational.
Sometimes, an oversold stock has a warning meaning that the price will decline further. This is because an oversold stock may be experiencing heavy selling pressure, which can cause the stock’s price to continue to drop.
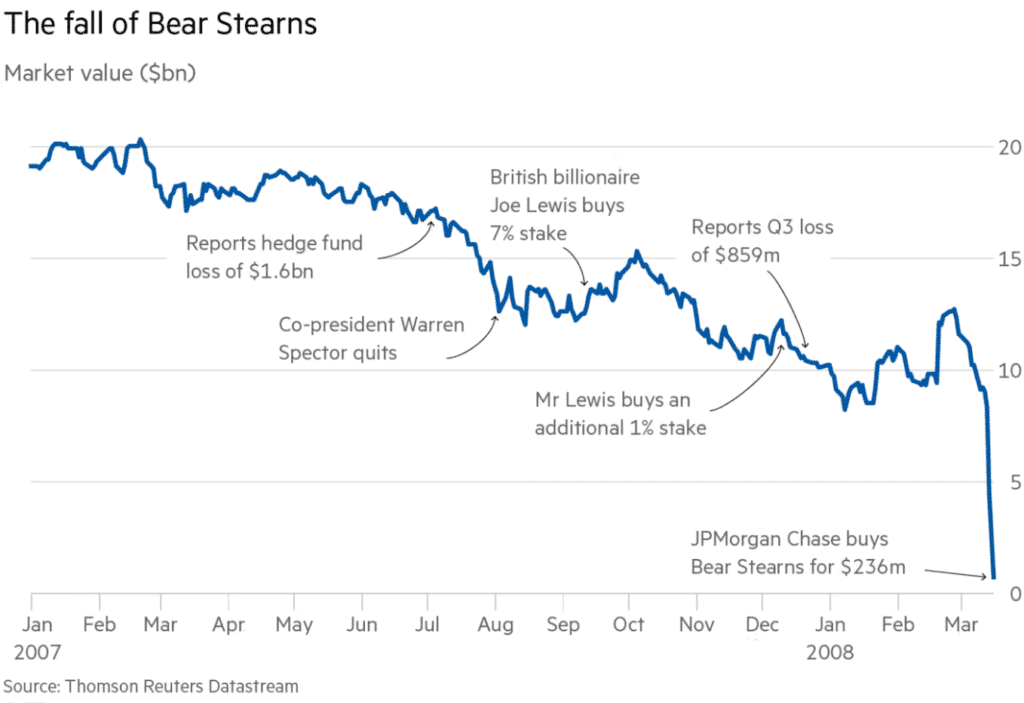
For example, Bear Stearns’ story occurred in 2008 during the financial crisis. As the market began to crash, many companies were considered oversold by traditional metrics. Bear Stearns, a large investment bank, reached oversold levels also. But then it went bankrupt a few months later. Investors who bought Bear Stearns stock at that time lost all their money.
In short, you should regard oversold as a reminder to conduct further investigation rather than a direct buy signal. Before making any trades, you need to consider the current and prospects of the asset. If unsure, it is best to wait for the price to rebound before entering. While this may result in missing some profit, it also reduces your risk.
Final Words
In conclusion, delving into oversold stocks can be fruitful for investors seeking to unearth profitable opportunities. In this post, I have introduced several methods for identifying oversold stocks. These include using technical indicators, such as RSI, MACD, and Bollinger Bands, as well as fundamental indicators, such as the P/E ratio.
However, it’s essential to approach this strategy with a discerning eye. You need to understand the true meaning of an oversold stock. Entering an oversold stock is not a guarantee of a successful investment. Instead, oversold may be a warning sign of further price declines due to heavy selling pressure. Thus, do not rely solely on technical indicators. It’s imperative to undertake a comprehensive analysis. To do this, you can take into account a company’s financials, management, and industry trends.
A long-term perspective is also crucial in making sound decisions regarding oversold stocks. Sometimes, an oversold stock may take a long time to rebound. Remember, investing in the stock market necessitates knowledge, patience, and a long-term outlook.


