Moving averages are reliable and easy-to-understand technical indicators that traders and analysts love to use. But if you’re new to using them, you might be confused that moving averages change in different timeframes.
For example, if you’re looking at a daily chart versus a yearly one, the moving average line will look very different, even if you use the same MA20 indicator. This can be pretty puzzling at first!
If you are confused by this and seeking answers, this is the information you need!
The Meaning of Timeframe in Moving Averages
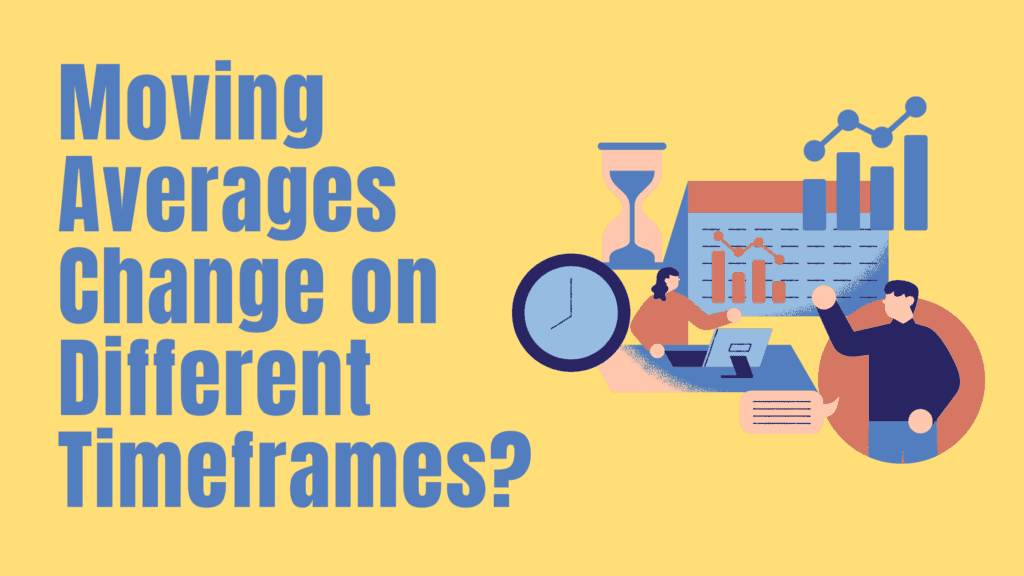
A moving average is a line on a chart that smooths out the price action by calculating the average price over a set period. For example, a 20-day moving average is calculated by taking the average of the closing prices over the past 20 days. If the timeframe changes, the moving average will also change accordingly. For instance, a 20-week moving average is calculated by taking the average of the closing prices over the past 20 weeks.
Changing the timeframe can significantly impact the moving average’s sensitivity to short-term price fluctuations. A longer period will capture long-term trends, while a shorter period will be more sensitive to short-term market movements. For instance, a 20-week moving average will be less sensitive to short-term price fluctuations than a 20-day moving average.
The Reason for Moving Averages Changes on Different Timeframes
After understanding the principle, I can answer why moving averages change on different timeframes.
Now, here’s the thing – most trading software doesn’t have a separate setting for the timeframe of the moving average line. Instead, you just choose a numerical value for the number of candles you want to include in the calculation. So, if you choose 20 as your value, the software will calculate the moving average line based on the last 20 candles in the chart, regardless of the timeframe.
This means that if you switch to a different timeframe, say from daily to weekly, the moving average line will still be calculated based on the last 20 candles in the chart. But because each candle in the weekly chart represents a longer term than each candle in the daily chart, the moving average line will appear to change.
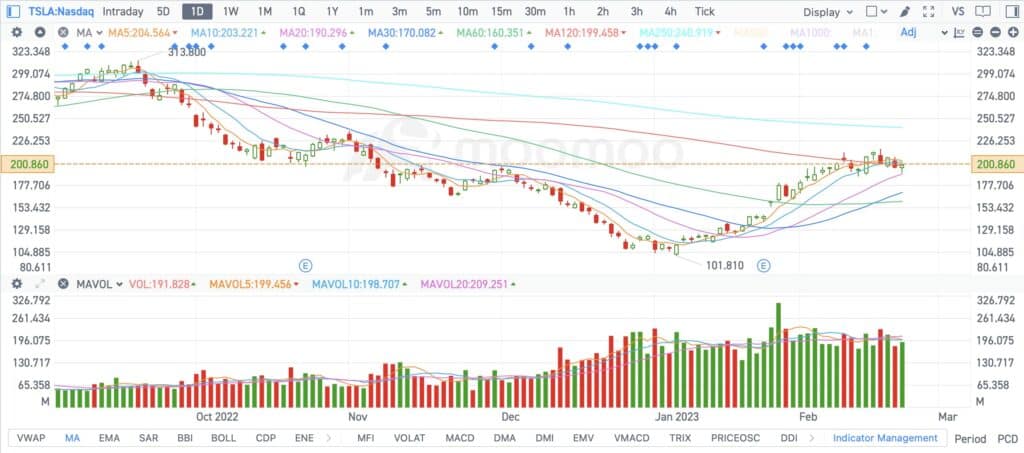
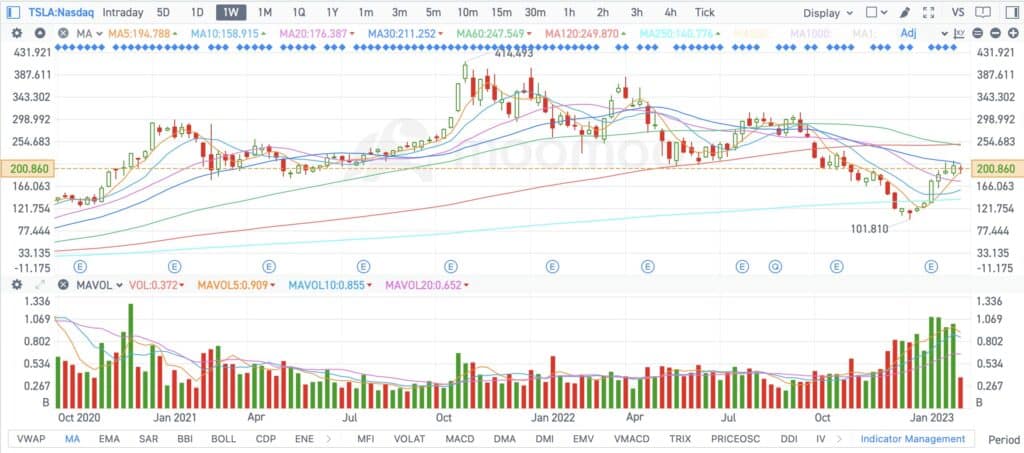
For example, if you’re looking at a 20-day chart and then switch to a 20-week chart, the moving average line will now be based on the average closing price of the past 20 weeks, instead of the past 20 days. So, even though the value you chose for the moving average line parameter is the same, the actual calculation changes depending on the time frame you’re looking at.
The Solution: Setting a Fixed Timeframe
Solving this particular issue on regular trading software can be challenging because they lack the necessary integrated features for trading charting. However, if you opt for a more specialized trading charting platform, you can solve this problem efficiently. A great option to consider is TradingView.
Related Reading: How to Use TradingView: A Step-by-Step TradingView Tutorial
TradingView is a powerful charting platform that offers a wide range of features, and the best part is that most of them are entirely free. You can easily implement a feature that keeps the moving average steady when switching time frames in TradingView. Here are the steps:
- Click the “Indicators” button in the chart window’s top toolbar.
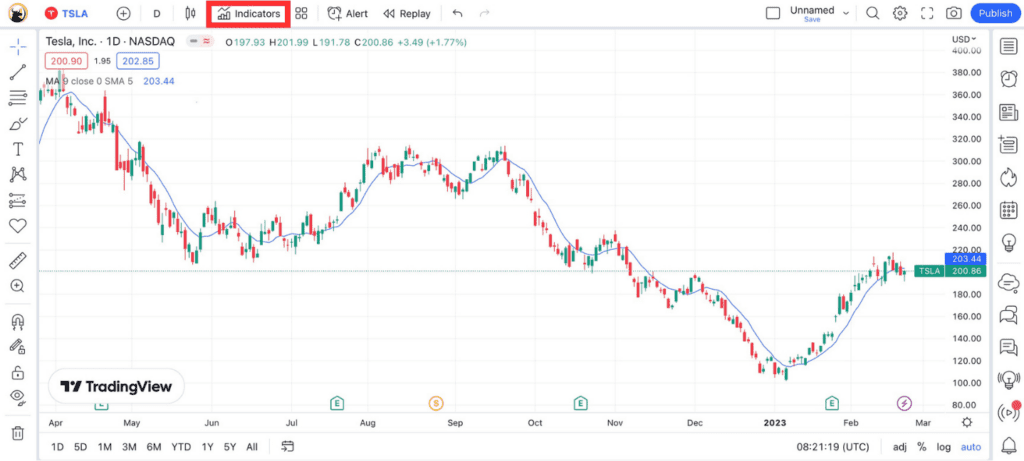
- In the “Indicators” panel, search for the moving average indicator.
- Click the small gear icon in the “Indicator Box” to open the settings menu.
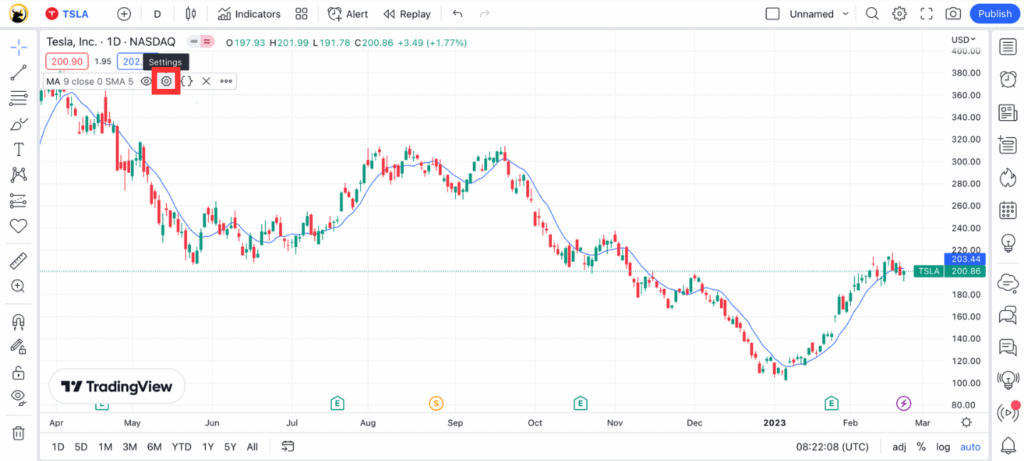
- In the “Input” section of the settings menu, you’ll see a field labeled “Timeframe.” This field determines the timeframe of the moving average.
- Change the value in the “Timeframe” field to the desired timeframe for the moving average.
- Click “OK” to apply the changes to the indicator.
The chart should now display the moving average with your new timeframe.
However, some traders may find it inconvenient to chart on TradingView and then switch to their brokerage platform to place trades. That’s where the platform’s connection feature comes in handy.
Connecting your brokerage platform with TradingView lets you have all your charting and trading needs in one place. This means you can easily analyze the markets, plot your trades, and execute them right from the same platform. It’s a seamless and convenient solution that saves your time and streamlines your trading workflow.


