Candlestick patterns are a popular and effective technique in trading across various financial markets, including stocks, futures, and forex. By mastering master the most reliable candlestick patterns, you can at least gain profits in the long run.
However, with so many candlestick patterns out there, it’s difficult to try them all. Plus, relying on a single pattern can be risky, so it’s best to use them in combination with technical indicators.
So, in this article, I will share the three most reliable candlestick patterns that I believe can help you increase your trading skills.
Hammer Candlestick Pattern with Stochastic Oscillator
What is Hammer Candlestick Pattern?
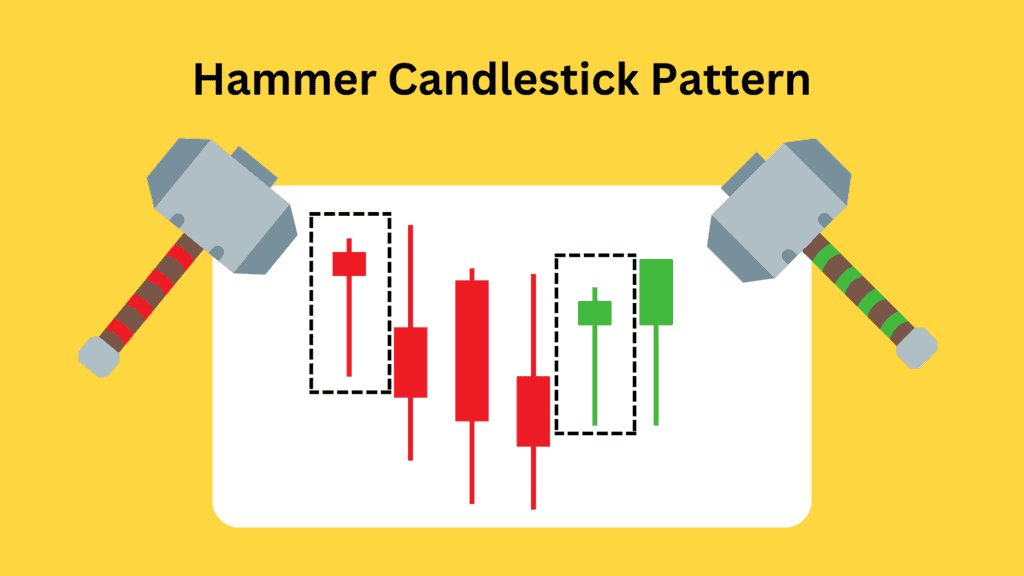
The hammer candlestick pattern appears as a small body at the top of a long shadow, with the length of the shadow at least twice that of the body. To be effective, the hammer candlestick pattern must occur at a significant low point.
Typically, the hammer candlestick pattern emerges when the market opens near its high point, then experiences a sharp drop throughout the day. However, it bounces back and closes near the opening price.
The hammer pattern is handy when the stock price is oversold. In this case, it indicates that the stock is due for a rebound. To determine whether the stock price is oversold, you can use technical indicators such as the stochastic oscillator.
What is Stochastic Oscillator?
The stochastic oscillator was created by George Lane in the late 1950s and is still widely used today by many traders and investors.
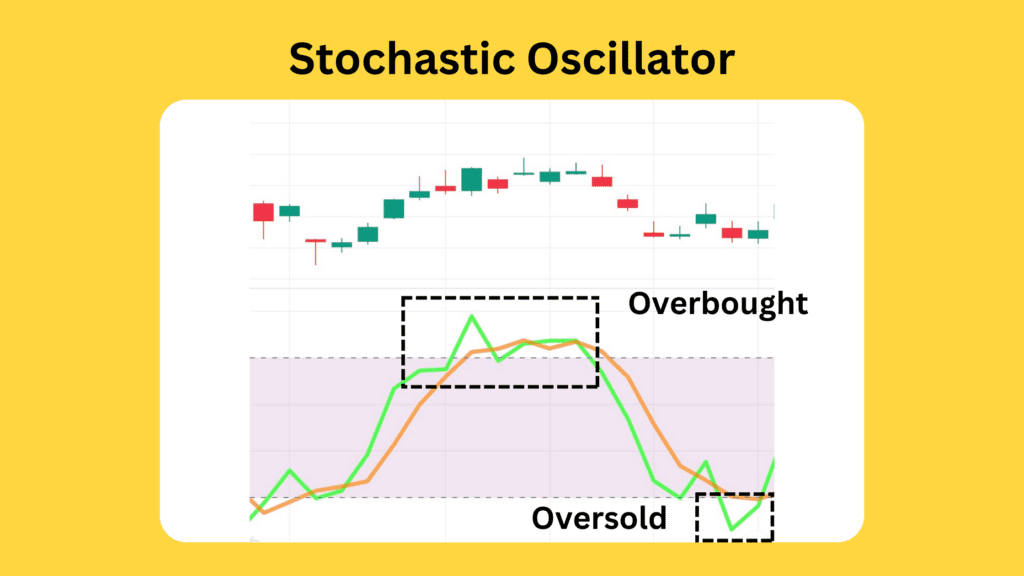
It compares an asset’s current closing price to its price range over a set period. Usually, this period is 14 days. This comparison is expressed as a percentage, with 0% representing the lowest point of the price range and 100% representing the highest point.
The stochastic oscillator has two lines you need to pay attention to: the %K and the %D lines. The %K line represents the current closing price as a percentage of the price range over the set period. On the other hand, the %D line is a moving average of the %K line that smooths out fluctuations in the oscillator.
This tool helps you identify when a stock is overbought or oversold. When the oscillator rises above 80%, the asset is considered overbought, which could indicate that the price is too high, and a correction could be on the way. On the flip side, when the oscillator falls below 20%, the asset is considered oversold, and a rebound could be on the way.
Hammer and Stochastic Oscillator: Predict Google Stock Reversals!
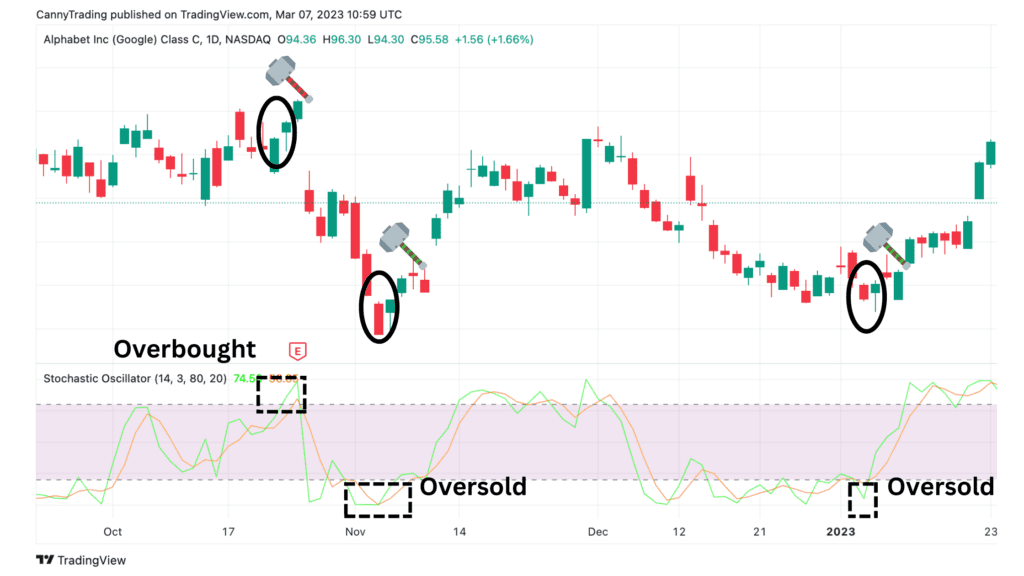
In Google’s case, three instances of the hammer candlestick pattern occurred on October 24, 2022, November 4, 2022, and January 6, 2023.
The latter two instances of the pattern appeared when the stock price was at an interim low point. Additionally, the stochastic oscillator indicator, which measures the momentum and strength of the stock price, was below 20, indicating that the stock was oversold.
When a hammer candlestick pattern appears at an interim low point and the stock is oversold, it suggests that the stock price is likely to rebound soon. And Google’s stock price did rebound significantly after these two instances of the pattern appeared.
However, the first instance of the pattern on October 24, 2022, was different. At that time, the stochastic oscillator indicator was between 70-80, indicating that the stock was not oversold but rather showing signs of being overbought. This meant the stock would likely experience a pullback instead of a rebound.
Therefore, the hammer candlestick pattern on October 24, 2022, was invalid and could have even been a trap. Subsequent trends confirmed this, as Google’s stock price declined by almost 20%.
Engulfing Candlestick Pattern with MACD Divergence
What is Engulfing Candlestick Pattern?
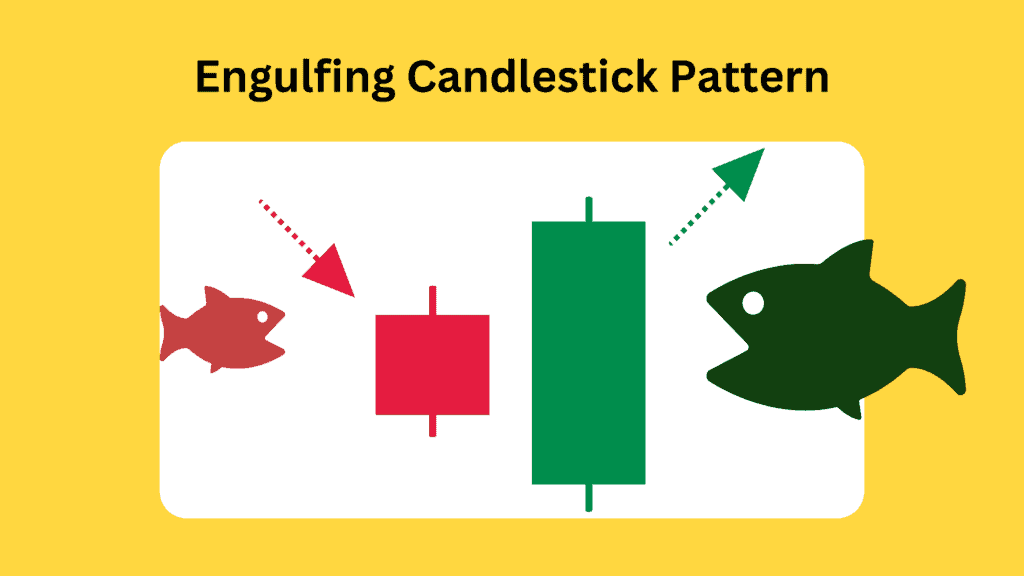
The engulfing candlestick pattern comprises two candles, one larger than the other, completely engulfing it. The larger candle indicates a substantial influx of funds into the market, completely reversing the trend represented by the previous candle and suggesting a likely reversal in the market.
There are two types of engulfing patterns: bullish and bearish. A bullish engulfing pattern occurs after a small red candle, followed by a larger green candle. Conversely, a bearish engulfing pattern occurs after a small green candle, followed by a larger red candle.
Engulfing patterns alone should not be the sole basis for trading decisions. It is essential to use engulfing patterns in combination with other technical indicators to confirm. Therefore, in the following example analysis, I will use the engulfing candlestick pattern in conjunction with MACD divergence.
What is MACD Divergence?
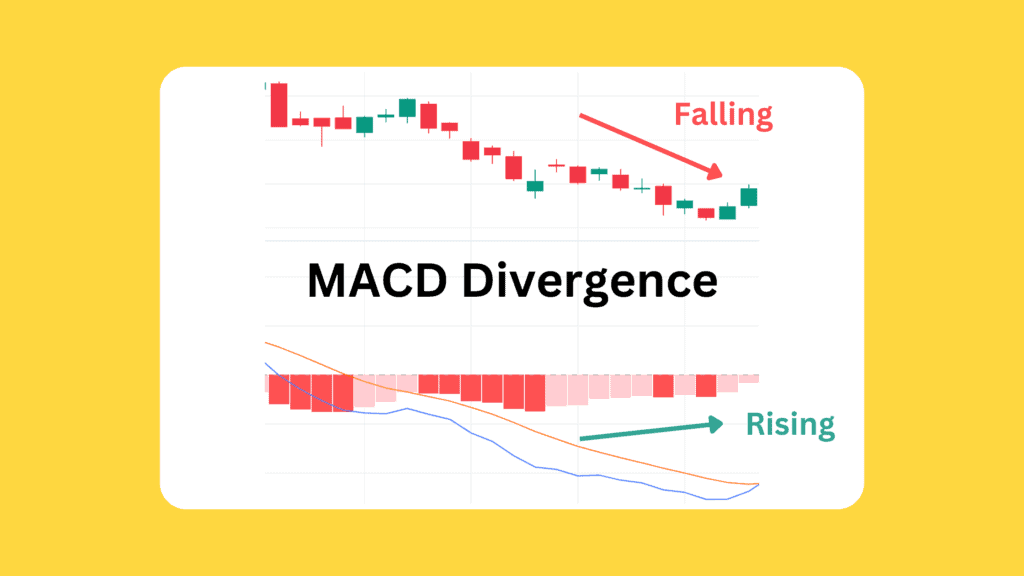
MACD divergence occurs when the asset price and MACD histogram move in opposite directions.
For example, when the price continuously creates higher highs, but the MACD histogram’s highs keep decreasing, a bearish divergence occurs. It indicates that although the price is rising, the momentum represented by the MACD is slowing down, indicating a potential downturn to come.
Conversely, if the price is decreasing, the downward momentum has weakened or even reversed upwards, then this is a bullish divergence. It suggests that the price decline may be coming to an end, and a trend reversal could be on the horizon.
Through MACD divergence, we can make the signals generated by Engulfing candlestick patterns more reliable.
Engulfing and MACD Divergence: Foresee TESLA Stock Rebound!
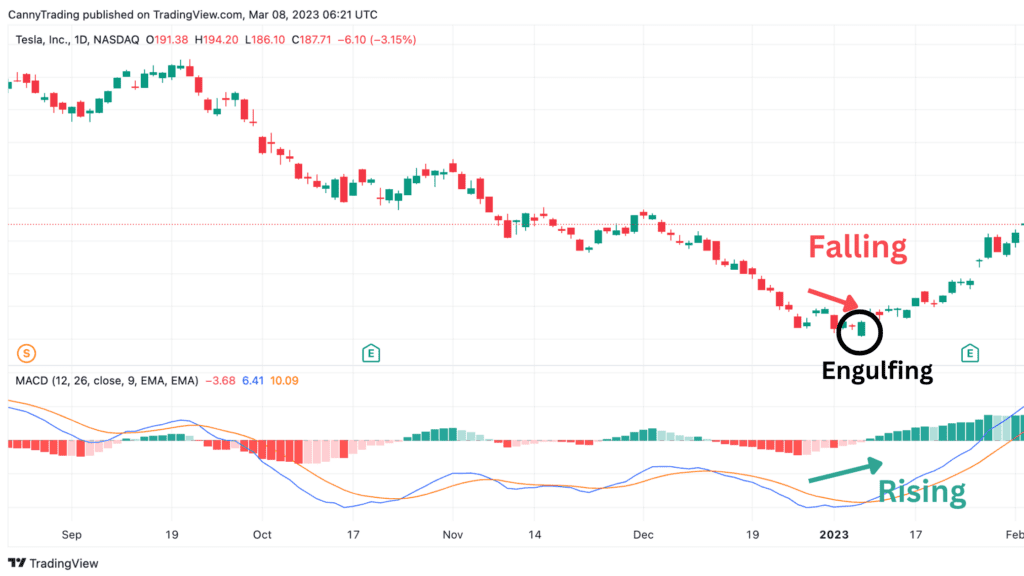
On January 6, 2023, Tesla’s stock price shot up with a massive bullish candle that engulfed the previous day’s small doji. This bullish signal suggested that the stock would likely rebound, but we needed more reliable information to confirm it.
Before this event, Tesla’s stock price was oscillating and even trending downwards. However, the MACD histogram continuously rose, indicating that the downward momentum decreased. The stock price was likely to rebound if there was a significant capital inflow.
On January 6, 2023, a large capital inflow arrived, causing the stock price to increase dramatically. This increase formed a long bullish candlestick, which was very convincing as it engulfed the previous day’s small doji. This engulfing candlestick pattern confirmed that Tesla was indeed likely to rebound.
This prediction proved accurate, as Tesla experienced a dramatic rebound following January 6. The stock price almost doubled, which was an exciting turn of events for Tesla investors.
Evening Star Candlestick Pattern with Fibonacci Retracement
What is Evening Star Candlestick Pattern?
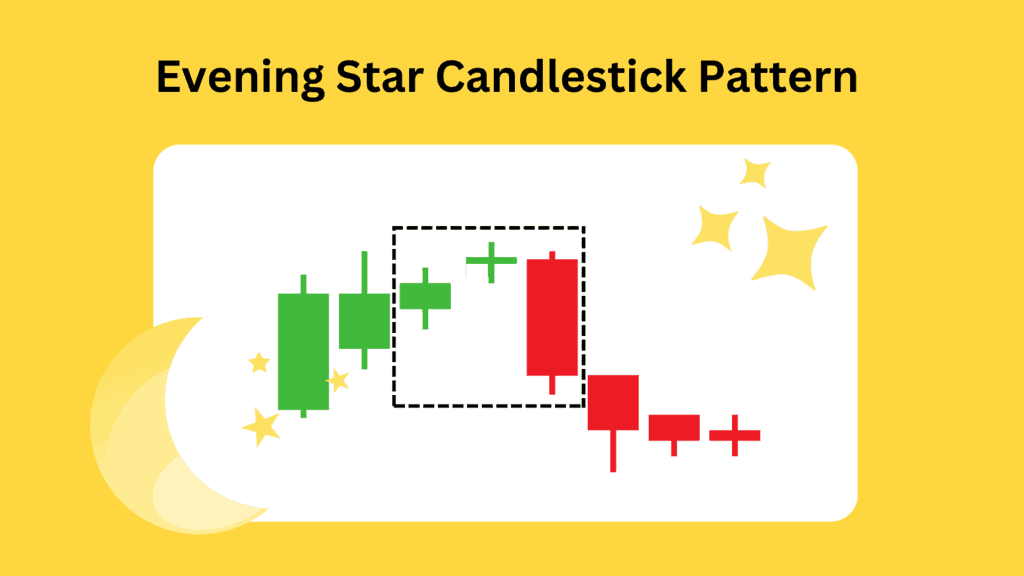
The Evening Star is a bearish reversal pattern in candlestick charting. It is formed when a small-bodied candlestick with a long upper shadow (the “star”) appears after a large bullish candlestick, followed by a third candlestick that opens lower and closes below the midpoint of the first candlestick’s body.
The pattern represents a shift in market sentiment from bullish to bearish. The large bullish candlestick at the beginning of the pattern signals that buyers are in control and have pushed prices higher. However, the appearance of the small-bodied star indicates that the buying momentum is slowing down, and the long upper shadow indicates that sellers are starting to push prices down.
The third candlestick, which is bearish, confirms the shift in sentiment and suggests that the bears have taken control. The pattern is more reliable if the third candlestick is larger and has a lower close than the first.
Related Reading: Morning Star Pattern and Evening Star Pattern
What is Fibonacci Retracement?
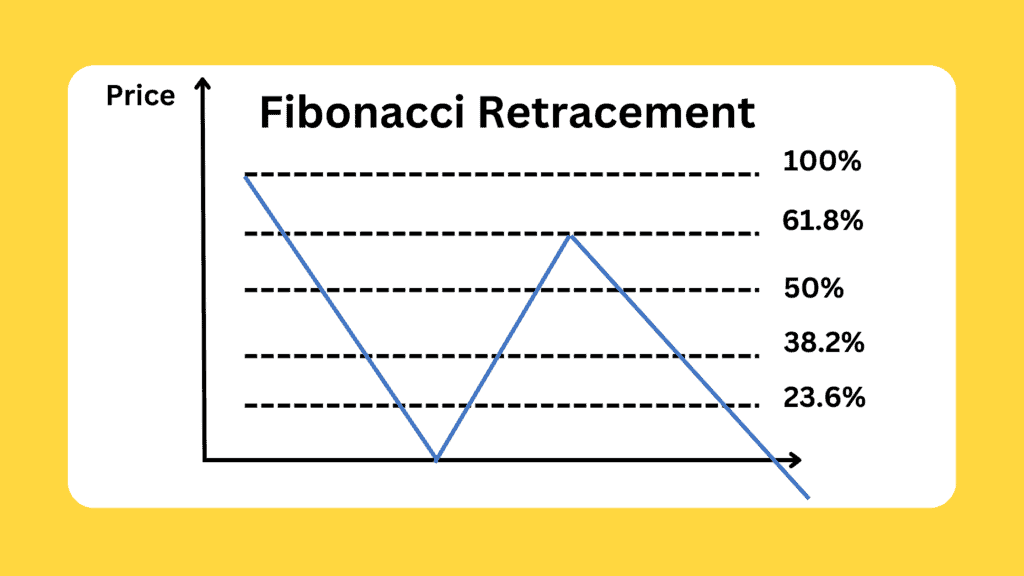
Fibonacci retracement is a tool traders use to identify possible support and resistance areas. It’s based on the idea that after a price movement, the market tends to retrace a predictable portion of that move before continuing in the original direction.
The tool is based on the Fibonacci sequence(0, 1, 1, 2, 3, 5, 8, 13, 21, 34, …), a sequence of numbers where each number is the sum of the two preceding numbers. This sequence calculates the potential levels of retracement after a price movement. The calculated retracement levels are Fibonacci ratios of 23.6%, 38.2%, 50%, 61.8%, and 100%.
To use Fibonacci retracement, traders first identify a significant price movement that can be considered a trend, whether an uptrend or a downtrend. They then draw a line between that trend’s high and low points, and the retracement levels are the Fibonacci ratios. These levels represent possible areas where the price could retrace before continuing in the original trend direction.
Evening Star and Fib Retracement: Identify the Short Selling Point of NVIDIA
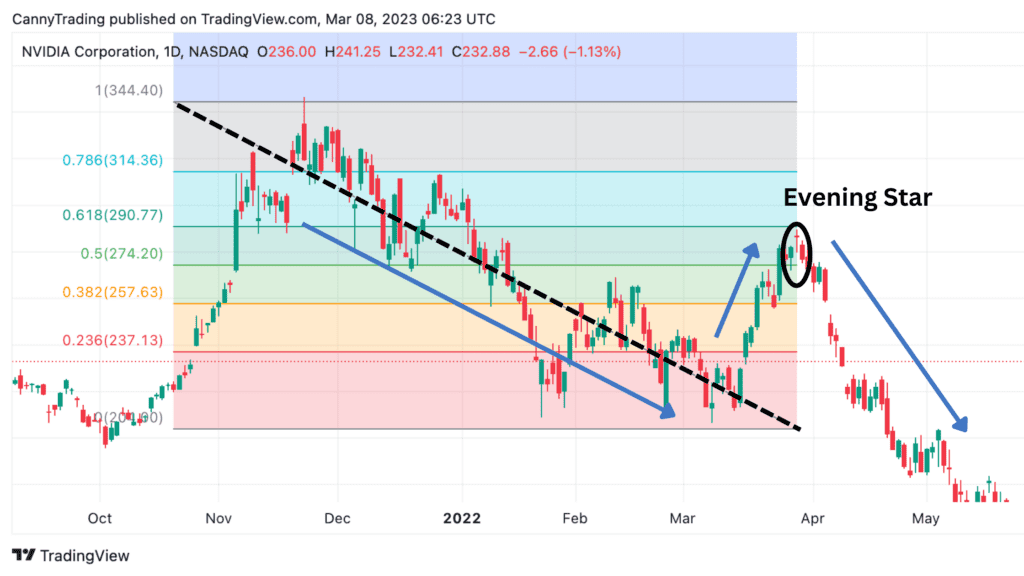
In early 2022, Nvidia’s stock took a hit due to the Fed’s expectation of interest rate hikes. It continued to fall until it reached a support level established in November 2021. However, the whole of 2022 is expected to be accompanied by the Fed’s monetary tightening policy, which could hurt Nvidia’s stock performance throughout the year.
So, when is the right time to short Nvidia? A potential opportunity arose when the stock price formed an evening star candlestick pattern from March 28th to March 30th, 2022. This pattern often indicates a bearish trend, making it a potential signal to sell.
Furthermore, the stock price rebounded by around 61.8% from the low point, which is a significant Fibonacci retracement number.
By combining these two signals, traders had more confidence in shorting Nvidia. And the prediction proved accurate, as the stock price continued to decline, falling by over 50%.
Final Words
Candlestick patterns and technical indicators can work together to improve prediction accuracy when trading. The combination of Hammer candlestick pattern and Stochastic Oscillator, Engulfing candlestick pattern and MACD Divergence, and Evening Star candlestick pattern and Fibonacci retracement are the three most reliable candlestick patterns to use.
It’s essential to note that flexibility is key when using these patterns. You don’t always have to use a specific technical indicator with a specific candlestick pattern. For example, when you see an engulfing candlestick pattern, you can use the stochastic oscillator to confirm it, instead of only relying on the MACD divergence.
I hope these three most reliable candlestick patterns can take your trading to the next level. Good luck with your trading journey!

