Investing isn’t short of options. Let’s say you’ve taken a leaf out of investing magnate Warren Buffett’s book and have decided to place your capital in a low-cost index fund. Even then, you’ve got decisions to make. Which fund will deliver the returns you’re after, offer the security you want, and provide the calm assurance you seek?
Step into the limelight, two power players in the sphere of S&P 500 Index ETFs – the Vanguard S&P 500 ETF (VOO) and the SPDR S&P 500 ETF Trust (SPY).
Though both ETFs strive to reflect the same index, they aren’t truly identical. In this VOO vs SPY showdown, we aim to examine the fine print of each fund.
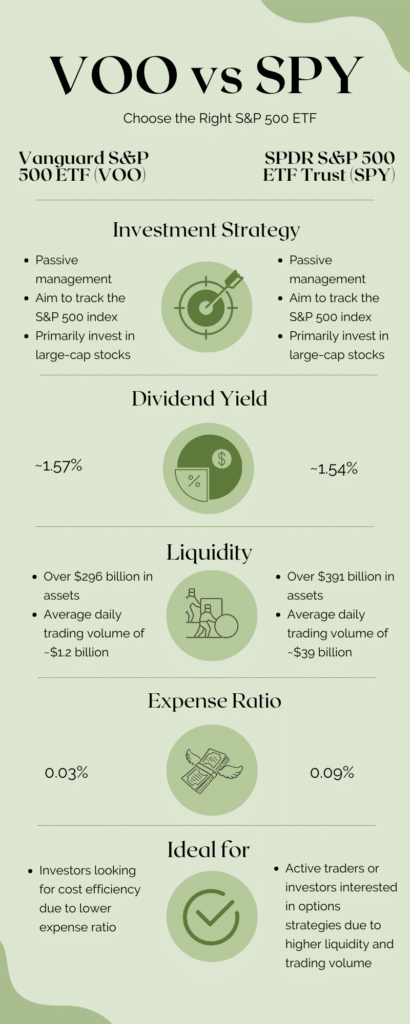
In a Hurry? Check Out This Quick Infographic!

VOO and SPY: A Closer Look
Let’s delve deeper into VOO and SPY. These two index funds are designed to shadow the S&P 500 Index. They follow a strategy of passive management. This means, rather than attempting to beat the market with constant stock trading, these funds simply aim to mimic the S&P 500 Index’s performance. This low-key approach keeps trading activity to a minimum, resulting in impressively low expense ratios.
Just like the S&P 500, VOO and SPY assign weights based on market capitalization. This simply means, the bigger a company’s market cap, the larger its influence on these ETFs. So, heavyweight corporations, like Microsoft or Apple, sway the ETF’s performance more than their smaller counterparts within the index.
SPY vs VOO: Similarities
Investment Strategy
The approach employed by both SPY and VOO highlights their core alignment in investment strategy. As touched on earlier, this is a ‘passive’ strategy. Their goal is to echo the S&P 500 Index’s performance as closely as possible. To achieve this, they maintain a stock portfolio that mirrors the index’s composition. So, if a company makes up 2% of the S&P 500 Index, it should constitute 2% of the assets in both SPY and VOO.

Given that VOO and SPY are reflections of the S&P 500, made up of the 500 largest U.S. companies, they naturally lean towards large-cap stocks. This focus on large-cap can offer some risk reduction, as these behemoth companies often possess solid business models, strong balance sheets, and diverse revenue sources.
However, this emphasis on the largest 500 companies has its downsides. VOO and SPY may lack exposure to the mid-cap and small-cap sectors, unlike more extensive index funds such as the Vanguard Total Stock Market ETF (VTI), which boasts around 4000 stocks. Adding smaller-cap stocks to your portfolio can widen your market exposure and may tap into additional growth opportunities.
Returns
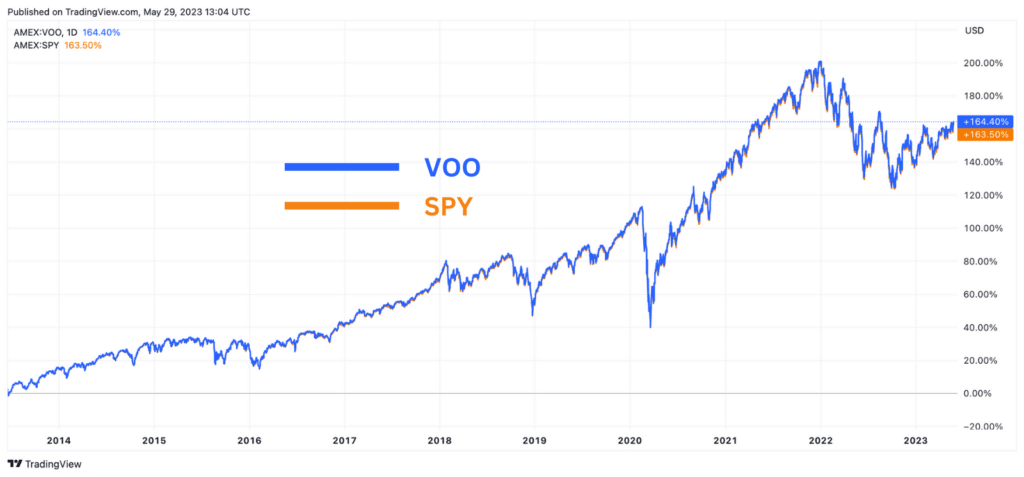
Given that VOO and SPY are both engineered to track the S&P 500, it’s no surprise they deliver strikingly similar returns. The S&P 500 has a history of steady growth, fuelled by the vigor of the U.S. economy and its markets. This mirrors the dynamism and inventiveness of the index’s constituent companies, many of which are global pacesetters in their industries.
Due to the inherent resilience and growth potential of the U.S. economy, both SPY and VOO have regularly yielded strong total returns. Provided that the foundational economic, the returns from these ETFs are anticipated to stay robust.
Nonetheless, while these funds offer excellent access to the U.S. market, they don’t offer much global diversification. Investors looking to fold international exposure into their portfolios might consider other ETFs. For instance, the Vanguard Total World Stock ETF (VT) can be a good choice. This fund offers a window into both U.S. and international stock markets, helping to add more color to your investment portfolio.
Dividend Yield
Although VOO and SPY are both famous for their impressive total returns, their dividend yield and growth are fairly modest.
According to recent data, SPY yields a dividend of about 1.54%, while VOO delivers a slightly higher yield at around 1.57%. The marginally higher yield of VOO might be partly attributed to its lower expense ratio.
When it comes to dividend distribution, VOO and SPY follow a quarterly schedule. They distribute the dividends from their holdings to investors on a regular basis. This consistent income can be attractive, but it’s essential to consider the tax implications, particularly for those based outside the U.S. Foreign investors face a 30% dividend withholding tax, which can significantly dent the net dividend received.
VOO vs SPY: Difference
Expense Ratio
The expense ratio reflects the annual fees a fund charges to manage operational costs. It’s expressed as a percentage of the fund’s average net assets.
VOO takes the lead in this area with an impressively low expense ratio of just 0.03%. In contrast, SPY sports a slightly higher expense ratio of 0.09%. This disparity might seem inconsequential at first glance. However, even a slight divergence in expense ratios can compound over time, potentially creating a noticeable dent in your overall returns.
Let’s paint a picture: Suppose you invest $10,000 in each of these ETFs and achieve an average annual return of 7% before fees. Fast forward 30 years, and the difference attributable solely to expense ratios would be around $1,800. This scenario shines a light on how small cost variances can convert into significant dollar amounts in the long run.
Since these funds aim to mirror the S&P 500 Index’s performance, outperformance isn’t the goal. The focus lies in tracking the index accurately while keeping costs to a minimum. From this angle, VOO’s lower expense ratio offers an advantage as it reduces the friction on returns.
Liquidity
SPY, being one of the world’s oldest and most respected ETFs, is renowned for its exceptional liquidity. As the largest ETF by assets under management (AUM), SPY boasts over $391 billion in assets. Even more impressive is its average daily trading volume of around $39 billion.
In contrast, VOO, although one of the biggest S&P 500 index funds, is comparatively smaller, with over $296 billion in assets. Its average daily trading volume, as of my last update, is $1.2 billion. Despite having lower liquidity than SPY, VOO’s liquidity is more than adequate for most retail investors. The size of VOO suggests there is no risk of it closing down, and the spreads (the difference between the bid and ask prices) are practically negligible.
However, SPY truly stands out in the options market. Thanks to its tremendous liquidity, SPY options trade with much narrower spreads compared to similar VOO options. For investors who incorporate options in their investment strategy, SPY offers a more fluid and efficient trading platform.
VOO vs SPY: Deciding the Better ETF
For investors eyeing the S&P 500 index, proxy investments like VOO and SPY come into play, since direct investment in the index isn’t feasible. Both represent trustworthy choices for those keen on gaining exposure to the overall market performance of the S&P 500.
Nevertheless, subtle differences come to light as we’ve sifted through their individual features. These might appear minor on the surface, but could become significant over time, swaying an investor’s decision.
If cost efficiency tops your priority list, VOO might edge ahead with its lower expense ratio. Despite the disparity seeming trivial, remember that even slight variations in costs can compound over time, leading to a noteworthy impact on your long-term returns.
Conversely, for the active trader or anyone interested in options strategies, SPY could be a more suitable choice. Its superior liquidity and more vibrant options market, thanks to its higher trading volume, can ensure smoother transactions and tighter bid-ask spreads.


