In the stock market, support and resistance are two important technical indicators that can help us grasp the trend of stock prices, identify buying and selling signals, and guide our trading strategies. Experienced traders have developed many methods to find support and resistance levels, such as line drawing and indicator analysis. If you haven’t learned support and resistance levels, the following article will introduce them thoroughly.
What are support and resistance?
What is the support level?
When the price falls to a certain level, a line or a zone supports the price and stops the decline. We call it the support level.
Some price zones have large trading volumes. The holding cost of most people falls within these zones. When the price turns from rising to falling and reaches these zones, the short-selling pressure has been exhausted. The buying pressure is greater than the selling power, causing the price to rebound. If it fails to break down the position many times, it will form a strong support level.
What is the resistance level?
When the price rises to a certain level, a line or zone exerts pressure on the price and affects the continued rise. We call it the resistance level.
Generally, two reasons may form a resistance line. It might be generated by the profit-taking of the short-term rise or the pressure of the eagerness to unwind the hung-up positions. When the price rises to a specific price zone, the selling pressure becomes more substantial, exceeding the buying pressure, and the stock price falls. A more robust resistance line will form if the stock price fails to break out many times.
Conversion between support and resistance
We should know that support and resistance levels are not set in stone. They convert each other.
The original resistance level will become a support level after an effective breakout. The initial support level will become a resistance level after an effective breakdown.
Supply and demand determine the support level and resistance level. The relationship between supply and demand comes from the psychology of buyers and sellers. When the price drop through a support level, it will cause some buyers to lose confidence and join the seller’s short-selling camp, leading to a sharp increase in supply and a decrease in demand. Once this situation appears, this price point will become a hung-up position for buyers who have not escaped. There will be many selling orders when the price rises near this zone. A support level change to a resistance level instantly.
In the same way, when the stock price breaks through a resistance level, people expect that rising will continue. There will be many buying orders, and the cost price is near the former resistance level. When the price falls near the level, there will be great demand, supporting the price to go up again.
How to find support and resistance levels:
1. Through moving averages
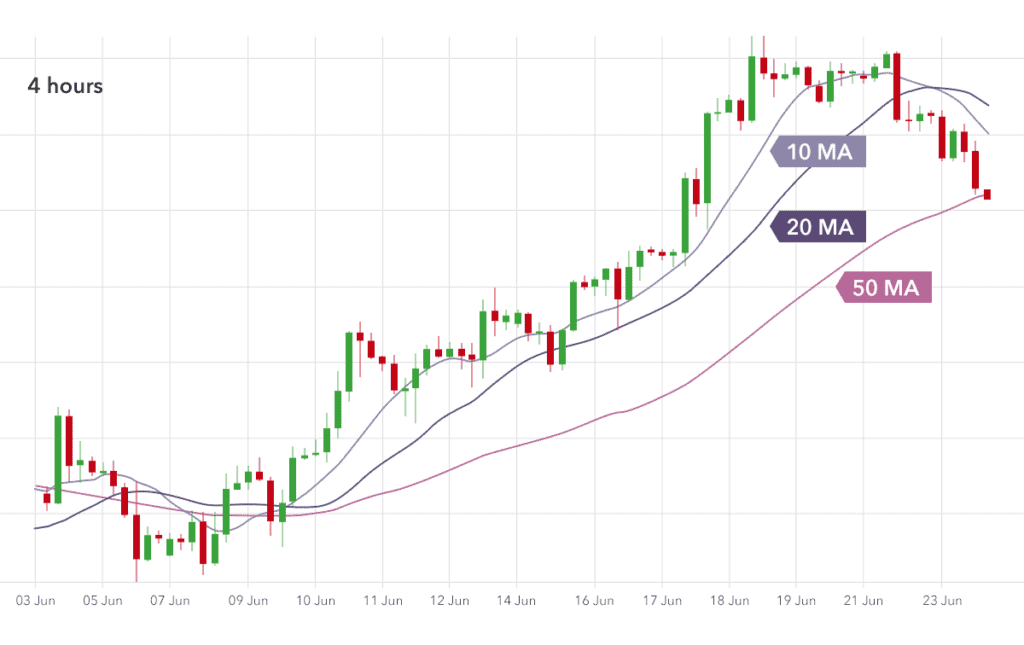
The moving average, in simple terms, is the average value of stock prices for a period of time. For example, the 10-day moving average is approximately equal to the average entry price of investors in the last ten trading days.
When the stock price falls and then rebounds to the 10-day moving average, the stock price is easy to form resistance because the cost of investors is equal to the 10-day moving average on average in the past ten trading days. Many investors may close their hung-up positions at this level. On the contrary, if the stock price retrace to near the 10-day moving average after rising, it is easy to generate resistance.
The longer the moving average period, the stronger the support or resistance. For a bullish stock, it will take longer for the stock price to fall to the long-term moving average. Not many short positions are left after falling near the long-term moving average. The buying pressure will form strong support. Conversely, it will take a long time for the stock price to rebound to near the long-term moving average. Many investors have hung-up positions for a long time and hope to sell after the price rises to the cost price, which suppresses the stock price.
2. Through short-term highs and lows
Support or resistance may also form when stock prices rise to short-term highs or fall to short-term lows. People are generally more inclined to close a position at a break-even point than at a loss. At the short-term high point, there are a lot of hung-up positions. When the price rises to that position, people’s willingness to sell will become stronger, forming selling pressure. On the contrary, relatively strong support will be created at the short-term low.
3. Through gaps
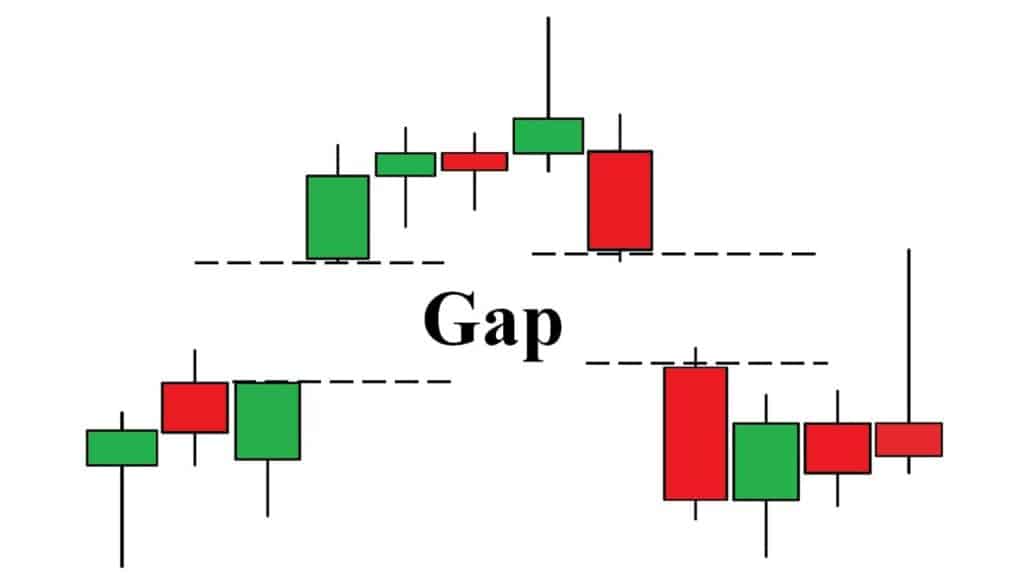
There are two situations for the formation of the gap: one is that the lowest price of the stock on a particular day is higher than the highest price of the previous day, and the other is that the highest price of a specific day is lower than the lowest price of the last day. In these cases, there will be a gap in the candlestick chart. That will cause the stock to have no trading volume in a specific range, forming a blank trading area. This empty area creates essential support and resistance levels (the larger the gap, the more obvious the effect of pressure and support).
4. Through trendlines
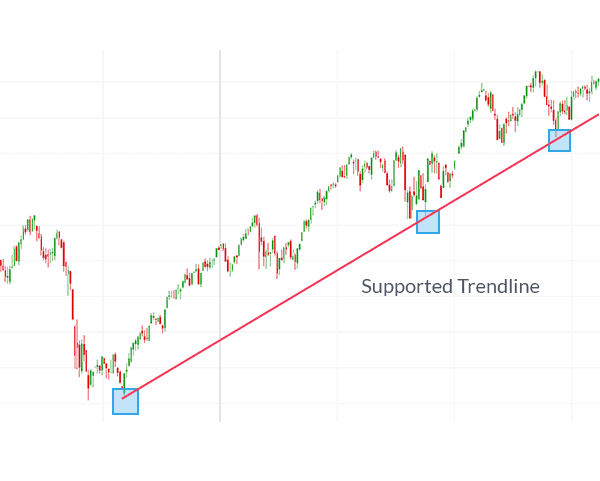
What is a trendline?
Technical analysts draw trendlines from past price movements of a security (stock) or commodity futures. Investors can use trendlines to predict price trends. The angle of a trendline will indicate whether a stock or commodity is in an uptrend or a downtrend.
Analysts connect more than two low points in a rising or two high points in a falling to get a trendline. The former is an upward trend line, and the latter is a downward trend line.
How to find support and resistance through trendlines?
An upward trend line can show the support level of a rising stock. Once the stock price falls below this line, it may imply that the trend may reverse from rising to falling. A downward trend line can show the resistance level of a falling stock. Once the stock price breakout this line, it means that the stock price may stop falling and rebound.
5. Through the golden ratio
What is the golden ratio?
The golden ratio evolved from some numbers. These numbers are 1, 1, 2, 3, 5, 8, 13, 21, 34, 55, 89, 144, 233. Any number is the sum of the previous two numbers: 2=1+1, 3=2+1, 5=3+2, and so on. Except for the first four numbers, the ratio of any number to the following adjacent number tends to be 0.618, that is, 5/8=0.625, 8/13=0.615, 13/21=0.619, 21/34=0.618, 34/55=0.618. 0.618 is the golden ratio, and the golden ratio divides 1 into 0.618 and 0.382.
In real life, there are also instances associated with the golden ratio. For example, people feel most comfortable in an environment of 22 to 24 degrees Celsius because the human body temperature is 36 to 37 degrees Celsius, and the product of 0.618 is 22.4 to 22.8 degrees Celsius. Some girls wear high heels to make the body ratio approximately 0.618, and so on.
How to find support and resistance through the golden ratio?
Let’s remember a few numbers first, which are 0.382, 0.5, and 0.618. These numbers are the famous Fibonacci retracement levels. When the price moves in the opposite direction of the trend, it usually follows some unique proportional characteristics. The retracement ratio of a stock price is often: 38.2%, 50%, and 61.8%. For example, a stock on an upward trend has a pullback. It may retrace to the 61.8% level and continue rising. So the 61.8% level is a support level. If the price breaks down the support level, it may enter a bear market.
6. Find support and resistance through the fan principle
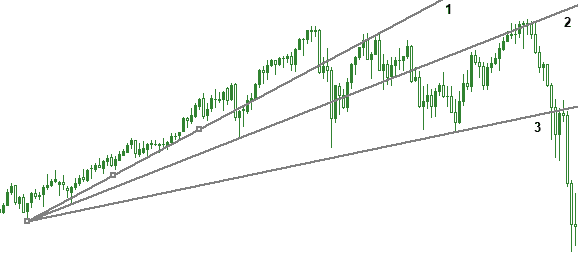
The fan principle is closely related to the trendline, which at first looks like an adjustment of the trendline.
The main idea of the fan principle is that the stock price must break multiple layers of support or resistance to reverse a trend. The stock price must break out many resistance lines to reverse from a downward trend to an upward trend. Similarly, the stock price must break down multiple support lines to reverse from an upward trend to a downward trend. We can consider neither a slight breakout nor a brief breakdown as a reversal.
In an upward trend, analysts draw an upward trendline with two low points. If the price pulls back and falls below the upward trendline, they can draw the second trendline by connecting the new low point with the first low point. If the price breaks down the second trendline again, draw the third trendline by connecting the latest low point with the original low point. These three lines, gradually gentler, are like an open fan.
If the three support lines drawn are broken continuously, the support and resistance will be exchanged.
What should you do when you encounter support and resistance levels?
The above article is still based on a theoretical point of view. What should you do when encountering support and resistance levels in actual trading? Support and resistance are two critical trade signals for buying and selling. Of course, this does not mean we should be all in, which is very wrong. As mentioned earlier, what used to be a support line may now act as a resistance, and what used to be a resistance line may now work as a support. That is an uncertain risk for us. What should we do?
It is an excellent way to trade in batches. For example, when we face the situation that the stock price is about to fall to the support level, we can buy some observation position. If we are unlucky and the stock falls below the support level, we will leave the market and stop the loss in time. If the price rebounds, we can buy further. The second buy affects our cost. But we must understand one thing, even if we lose part of the benefits, this also reduces the risk. For investment, of course, the more important thing is to minimize risk.
Conclusion
Support and resistance are essential and entry-level knowledge for stock trading and cryptocurrency trading. Finding the proper support and resistance levels can significantly increase your profits. This article introduces the basic concepts of support and resistance and five ways to find support and resistance, hoping to help your trading. If you want to learn more about the knowledge and strategies of the stock market, cryptocurrency market, and futures market, you can visit Canny Trading.


