The stock market is, by its very nature, a world of unpredictability. Despite this, traders often decipher specific trends through a detailed and disciplined analysis. In the intricate trading realm, one strategy stands as a reliable beacon – the study of candlestick patterns.
Two patterns, in particular, hold a consistent significance in this realm. They are known as the Rising Three Methods and the Falling Three Methods. These patterns continue to be of recurrent relevance in the ever-evolving landscape of the stock market. Their analysis and understanding can become the key to unlocking potential trading opportunities.
The Rising Three Methods Candlestick Pattern
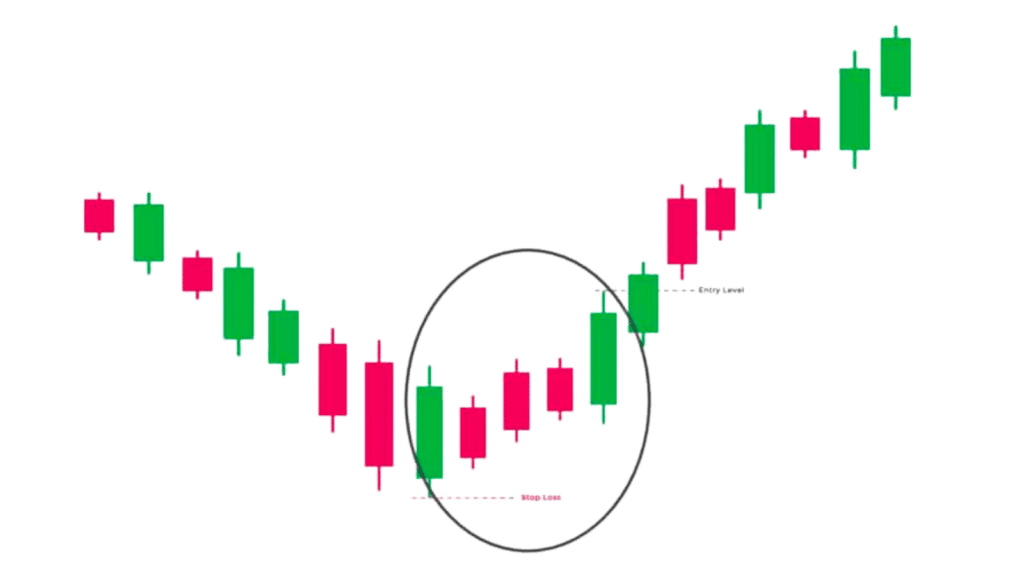
The rising three methods candlestick pattern usually appears over five distinct candlesticks within a market trend. Specifically, it’s a pattern that shows up in uptrends, signaling a bullish market mood. This pattern offers traders a dependable sign: the upward trend is poised to continue. For traders, this might mean an opportune time to buy or a reassuring signal to hold on to their current positions.

How to Spot the Rising Three Methods Pattern
- Spot the Initial Large Green Candlestick: The pattern kick-starts with a significant bullish (green) candlestick. This first candlestick stands for a robust price increase, affirming the existing upward momentum. It also sets the stage for the pattern to follow.
- Identify the Trio of Smaller Candlesticks: After the initial large green candlestick, keep an eye out for three smaller candlesticks in succession. These may be bearish (red) or bullish (green), but they’re typically bearish, hinting at a short spell of profit-taking. Ideally, these three candlesticks should stay within the price range of the first large green candlestick.
- Look for the Concluding Large Green Candlestick: The pattern wraps up with one more sizable bullish (green) candlestick. This fifth candlestick serves as the final seal of the pattern, suggesting the uptrend is set to continue.
Key Features of the Rising Three Methods Pattern
- The Placement of the Small-bodied Candlesticks: In between the two long bullish candles, we see a trio of small-bodied candlesticks. These represent a brief pause or consolidation within the overarching bullish trend. While it’s acceptable for these candlesticks to exceed the high of the initial long bullish candle, they should never fall below its low.
- The Role of the Final Bullish Candlestick: The concluding bullish candle in the pattern is pivotal in affirming the Rising Three Methods pattern. This candle should be long, signaling robust buying activity. However, if the closing price of this candle fails to surpass the closing price of the first candle, it might undermine the pattern’s strength, indicating a potential lack of bullish momentum.
- The Context of an Upward Trend: Fundamentally, the Rising Three Methods pattern is a bullish continuation pattern. As such, its occurrence during a downtrend might not serve its purpose or provide reliable predictive value. Ideally, this pattern should present itself within an unmistakable uptrend, characterized by a series of higher highs and higher lows.
Case Study: Tesla’s Stock (TSLA)
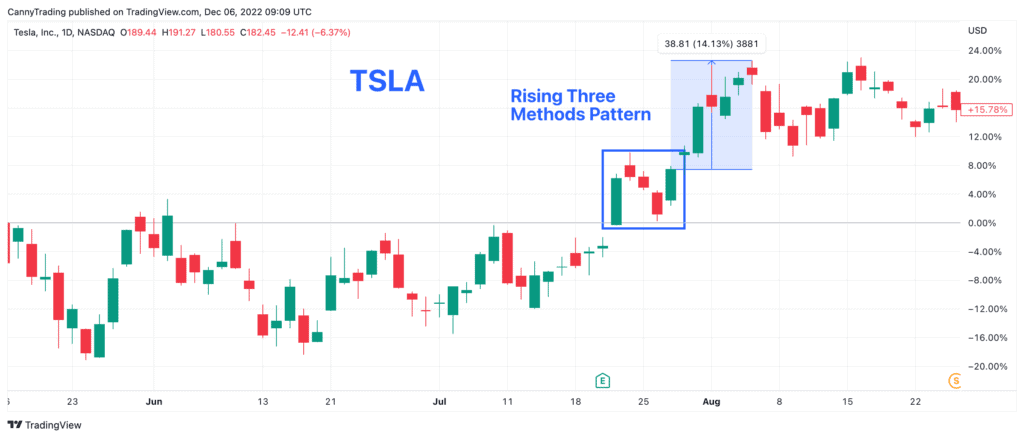
Let’s explore a case where this pattern appeared in Tesla Inc’s stock (TSLA). This happened between July 21st, 2022, and July 27th, 2022.

On July 21st, 2022, TSLA saw a sturdy 9.78% uptick. This produced a long bullish (green) candlestick, which marked the start of our pattern. Over the next three trading days, the stock recorded a slight drop. This gave us a set of three smaller-bodied candlesticks. Most notably, even at their lowest point, these three candlesticks stayed above the lowest price from the initial bullish day. This alignment with the initial candlestick’s range is a crucial condition for our pattern.
On July 27th, 2022, the pattern reached its conclusion. Tesla’s stock jumped by 6.17%, forming another large bullish candlestick. More importantly, the closing price was higher than the closing price from the first day. This five-day candlestick series perfectly aligned with the Rising Three Methods pattern. It suggested a probable continuation of the uptrend.
In the following weeks, this pattern proved its predictive value. Even if an investor had bought at the highest point on July 27th, they would have seen an estimated return of 14% over the next two weeks.
The Falling Three Methods Candlestick Pattern
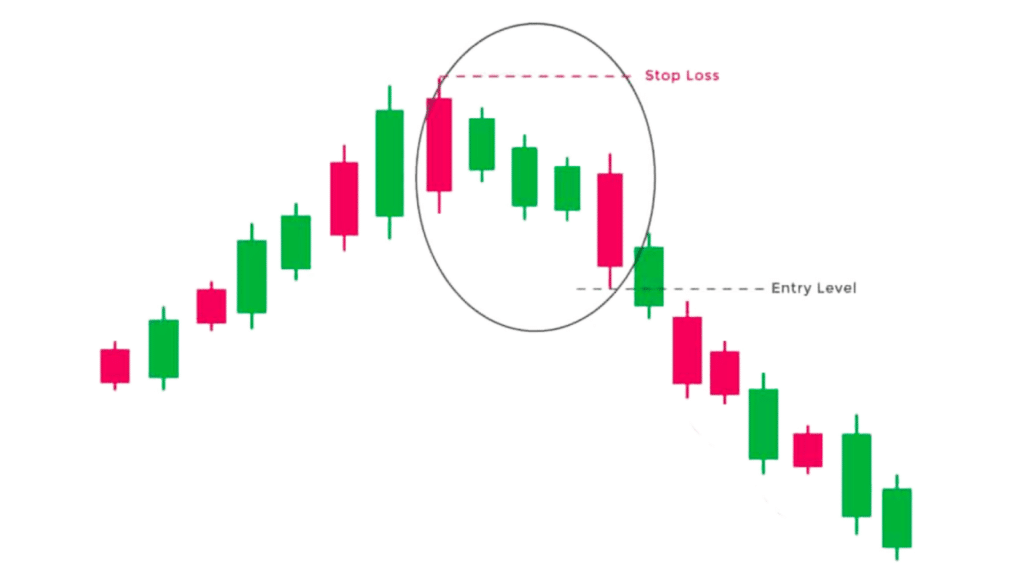
Just like its counterpart, the rising three methods, the falling three methods candlestick pattern also consists of five candlesticks. Typically, You’ll spot this pattern within a downtrend, which signals a bearish market mood. This pattern could hint at a prime time to put a stop-loss strategy in place or consider exiting a position.

How to Spot the Falling Three Methods Pattern
- Find the Initial Large Red Candlestick: The pattern begins with a substantial bearish (red) candlestick. This initial candlestick represents a significant price drop, strengthening the ongoing downward momentum. It also lays down the framework for the pattern that follows.
- Look for the Trio of Smaller Candlesticks: Next, three smaller candlesticks come into play after the initial large red candlestick. These may either be bullish (green) or bearish (red), though they’re usually bullish, hinting at a short buying phase. Ideally, these three small candlesticks should stay within the price range of the initial large red candlestick.
- Identify the Concluding Large Red Candlestick: The pattern wraps up with another sizeable bearish (red) candlestick. This fifth candlestick signals the downtrend is set to continue.
Key Features of the Falling Three Methods Pattern
- Role of the Small-bodied Candlesticks: The group of three small-bodied candlesticks that come after the first long bearish candlestick is essential. These candlesticks may drop below the low of the initial bearish candlestick, showing bearish sentiment. However, they mustn’t exceed the high of the first bearish candlestick.
- Importance of the Final Bearish Candlestick: The fifth candlestick in the pattern is decisive in confirming the Falling Three Methods pattern. Ideally, it should be long, indicating strong selling activity. Most importantly, its closing price should be lower than the first candlestick’s closing price.
- Need for a Downward Trend: Fundamentally, the Falling Three Methods pattern is a bearish continuation pattern. Its predictive value is strongest in a clear downtrend, marked by lower highs and lower lows. If it appears in an uptrend, it might not provide the expected predictive value and could suggest a possible trend reversal.
Case Study – Microsoft’s Stock (MSFT)
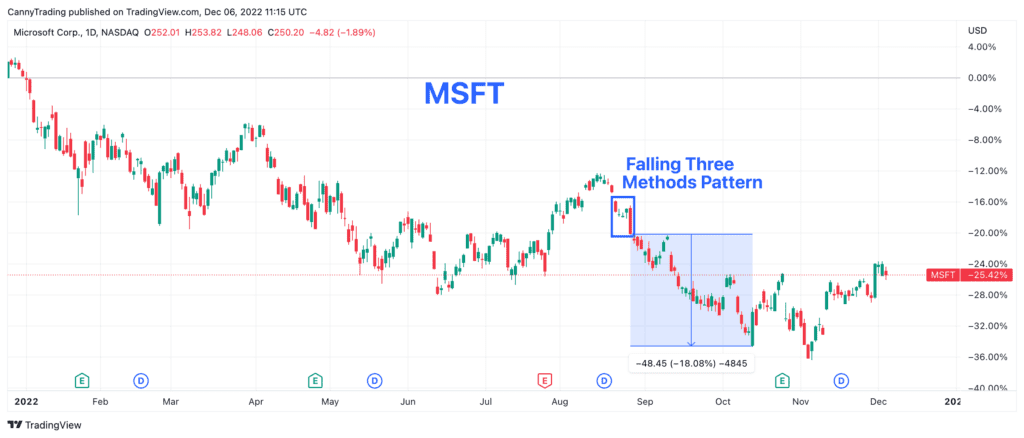
Consider a case where the Falling Three Methods pattern appeared in Microsoft Corp’s stock (MSFT). This was observed in August 2022.

On August 22nd, 2022, Microsoft’s stock fell by 2.94%. This led to a large bearish (red) candlestick, setting the stage for our pattern within a pre-existing downtrend. The following three trading days saw minor price shifts. This resulted in three smaller bullish (green) candlesticks. Most importantly, these candlesticks never exceeded the high of the initial bearish candlestick. They stayed within its price range, which is a vital part of the pattern.
The pattern’s verification occurred on August 26th, 2022. The stock dropped by a sharp 3.86%, creating another long bearish candlestick. This candlestick closed lower than the closing price of the first day. This confirmed the Falling Three Methods pattern.
This pattern was a crucial indicator of the ongoing downtrend. If an investor had identified this pattern and sold their Microsoft shares on August 26th, they could have possibly sidestepped a significant loss of around 18% in the following period.
Final Words
The Rising Three Methods and Falling Three Methods candlestick patterns serve as valuable tools for anticipating continuations of uptrends and downtrends, respectively. It’s important, however, to note that textbook forms of these patterns don’t pop up every day in financial markets.
In real-world scenarios, you might find more than three small-bodied candlesticks nestled between the two long ones, straying from the ideal five-candlestick structure. But the central concept stays the same: a brief pause in a trend, swiftly followed by a vigorous return to the original direction. As investors, recognizing these deviations and applying the basic principles of the three methods patterns is critical.
Relying on these patterns should not be a mechanical exercise. Instead, they should be approached as part of a comprehensive, flexible toolkit in your trading strategy.


