Day trading, the practice of buying and selling securities within the same trading day, has become increasingly popular in recent years. The allure of potentially making quick profits attracts many individuals to the markets. However, the fast-paced and volatile nature of the markets can also make it a risky endeavor. You need to navigate this complexity and increase your chances of success. One great way to achieve it is by using day trading patterns to identify opportunities.
These patterns, formed by historical market movements and trends, can serve as potential buy and sell signals. By studying and recognizing these day trading patterns, traders can gain a deeper understanding of the market. Therefore, they can make more enlightened decisions. This can lead to better risk management and potentially increase their chances of success. From head and shoulders to support and resistance levels, each pattern offers a unique insight into market behavior. In this blog post, we will explore the different types of day trading patterns and how we can use them to identify opportunities in the market.
Common day trading patterns
There are a variety of common patterns that traders use to guide their decisions, each with their unique characteristics. Some of the most common day trading patterns include:
Head and shoulders (H&S) pattern
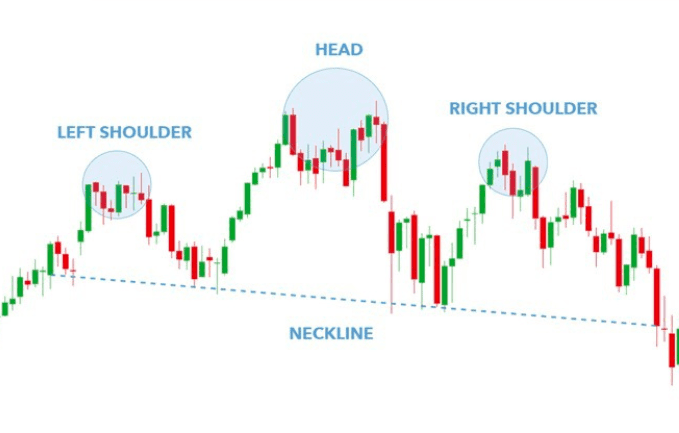
The head and shoulders (H&S) pattern is a bearish reversal indication. It is formed by three peaks: left shoulder, head, and right shoulder. The peak in the middle, the head, is the highest. The other two peaks, the shoulders, are roughly at the same level. The pattern confirms upon a breakdown of the neckline, a trendline connecting the lows of the shoulders. It suggests trend reversal after a prolonged uptrend.
The left shoulder forms as the bulls push prices higher, but the bears step in and create resistance. As the bulls gather strength and form the highest point, the bears are more muscular and make prices back down, forming the head peak. The right shoulder is formed when the bulls try to push again, but the bears step in and cause a price decline. A bearish reversal pattern forms, which suggests selling and taking profits as the trend is likely to reverse.
There are also different variations of H&S. They can be useful in determining the potential trend reversal. That’s why many traders keep an eye out for the formation of this pattern.
Double top pattern
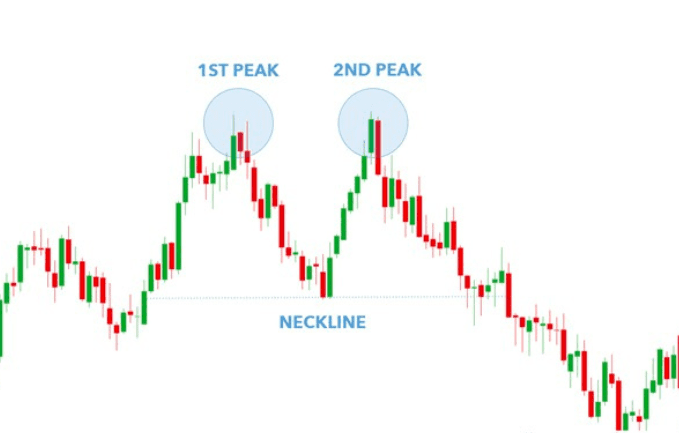
The double top is a bearish reversal pattern formed by two peaks at approximately the same level, separated by a trough. It’s an indication of a possible trend reversal after an extended uptrend. The breakdown of the neckline, a trendline connecting the lows of the two peaks, triggers a sell-off. It suggests that the bulls lose momentum and bears take control, leading to a potential trend reversal. This pattern is particularly useful in short-term trading, indicating a potential shorting opportunity.
For example, let’s say that a stock has been in an uptrend for some time and reaches a resistance level (first peak). After the hit, the stock price starts to decrease (trough). As buyers try again to push the price up, they hit the same resistance level. Unfortunately, the stock price drops again (second peak), forming a double top pattern. When confirmed by the neckline breakdown, this pattern can indicate that the bulls have lost their momentum and bears have taken control, suggesting selling and taking profits.
Cup and handle pattern
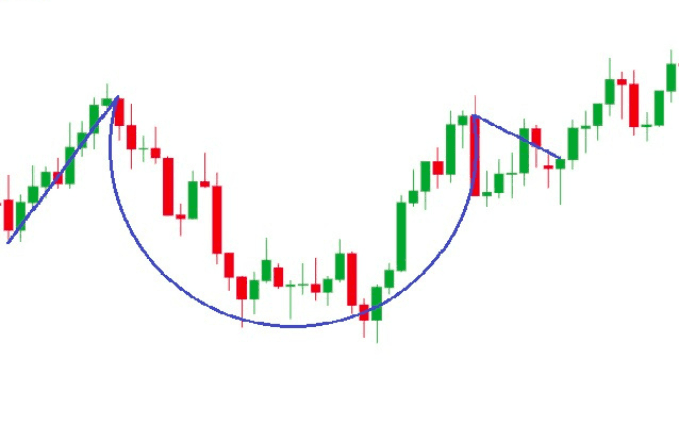
To identify a cup and handle pattern, traders typically look for a few critical characteristics on a price chart. Firstly, the cup should be a “U” shaped curve. It indicates a period of accumulation where the asset’s price has undergone a downward trend followed by a gradual and consistent climb. This structure should be relatively shallow, pointing towards a period of consolidation rather than a steep decline.
Next, the handle, a defining characteristic of the pattern, should be a small and short-lived dip in the asset’s price. This decline should be relatively brief, and the volume of trading during this period should be below the average volume seen during the formation of the cup.
Additionally, traders observe for a breakout point, which is marked by a resistance level formed by the peak of the cup. This suggests the price is about to move higher.
A critical aspect to consider is the volume of trades. A high volume at the bottom of the cup and decreasing volume during the handle can signify investor interest and conviction in the stock. Additionally, the pattern can also occur in a downward trend known as “inverse cup and handle,” which is a bearish indication.
Support and resistance
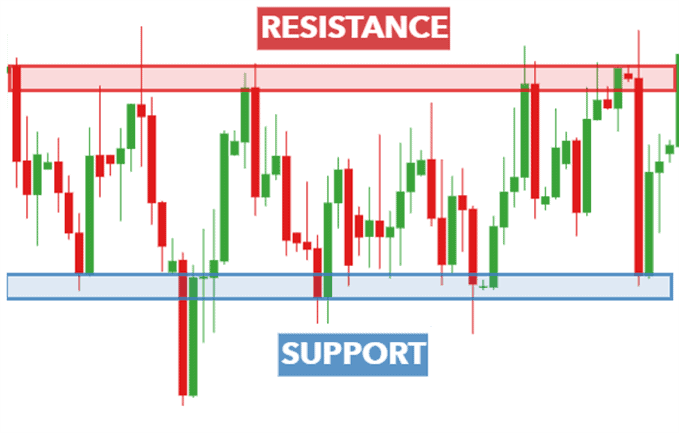
In day trading, support and resistance levels play a crucial role in determining entry and exit points for trades. Traders can identify them by analyzing historical price data. We use them to predict where a security’s price may experience buying or selling pressure. Support refers to the price level at which demand for security is strong enough to prevent the price from falling further. Conversely, resistance refers to the price level at which selling pressure we believe is strong enough to prevent the price from rising further. Traders often use these levels in combination with technical analysis to determine where to enter and exit trades.
These levels are not static and are subject to change over time. They are also sensitive to factors such as economic news or changes in market sentiment. There are many ways to identify support and resistance levels, such as moving averages, short-term highs and lows, gaps, and even the golden ratio. If you are interested in this, you can read related articles.
Related article: Support And Resistance – Take Your Trading To The Next Level!
Day trading patterns with technical indicators
Technical indicators are helpful tools for analyzing past and current market conditions. They offer a unique perspective on market behavior. Enhance your analysis by understanding how to combine different indicators and interpret their signals.
Moving Average (MA)
In day trading, investors use moving averages commonly as a technical indicator to analyze the price action of a security. A moving average is a statistical calculation that plots the average value of a security’s price over a specified number of periods. The two most widely used types of moving averages are the simple moving average (SMA) and the exponential moving average (EMA). The SMA is calculated by taking the sum of the closing prices and dividing it by the number of periods. In contrast, EMA assigns more weight to recent prices and thus is more sensitive to price changes.
Traders often use moving averages in combination with other indicators and chart patterns to identify potential day trading opportunities. For instance, when the price crosses above its moving average, it is a bullish signal. It indicates that the security may be experiencing upward momentum. In that case, it could be a good candidate for a long trade. Conversely, if the price crosses below its moving average, we can consider it a bearish signal. The security may continue to drop. It could be a good chance for us to take a short position.
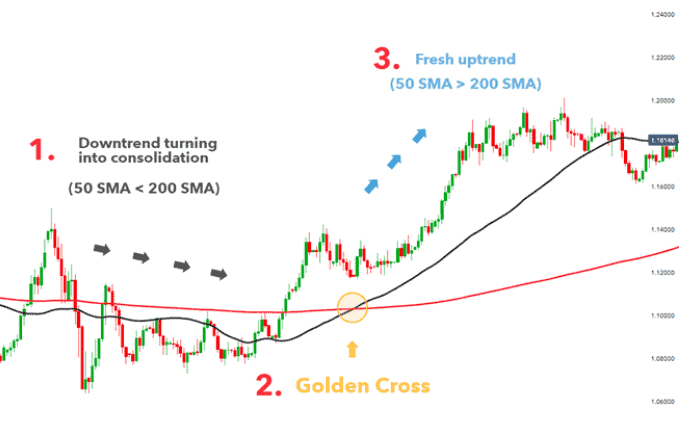
Another widely used pattern is the moving average crossover. Two moving averages of different timeframes cross over each other, indicating a change in trend. The Golden Cross and the Death Cross, formed by the crossover of two moving averages, with one being a longer-term MA and the other being a shorter-term MA, are also popular among traders. The golden cross signifies a bullish trend, and the death cross is a bearish trend.
Relative Strength Index (RSI)
Day traders commonly use Relative Strength Index (RSI) to evaluate the strength of a particular stock or asset. The RSI compares the magnitude of recent gains to recent losses to determine an asset’s overbought or oversold conditions. People often consider a stock is overbought if its RSI is above 70 and oversold if its RSI is below 30.
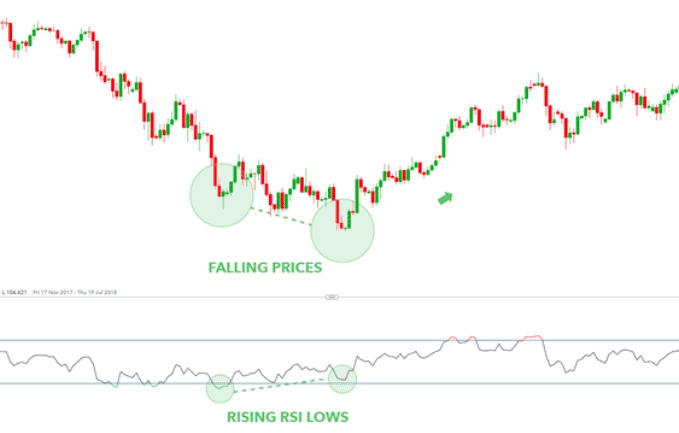
One typical day trading pattern traders look for using RSI is the “bullish divergence.” This occurs when the RSI makes a higher low while the stock price has a lower low. It shows that momentum is shifting, and the stock may be ready for a bullish move. Conversely, the “bearish divergence” pattern happens when the RSI is making new highs while the stock price is not, suggesting that the asset’s downward momentum is increasing and a bearish move may be imminent.
Another way traders utilize RSI in day trading is through “failure swings.” A failure swing is a signal generated when RSI moves above 70, pulls back, and then moves above 70 again, indicating a possible overbought condition and possible reversal. Similarly, when RSI moves below 30, pulls back, and then moves below 30 again, it could suggest an oversold condition and a potential reversal.
One important thing to remember about RSI is that it is a lagging indicator, meaning it is reacting to price changes rather than predicting them. Even if the RSI indicates an overbought or oversold condition, the stock price can continue in that direction for an extended period of time.
Also, you should not solely rely on RSI but use it in conjunction with other analytical techniques. They together can form a comprehensive view of a stock or asset. Some traders combine RSI with candlestick chart patterns such as bullish harami or bearish harami cross to make a better trading decision.
Risk management when using day trading patterns
Risk management is a fundamental aspect of day trading. Stop-loss and take-profit orders can act as guardrails for traders by providing predetermined levels for exiting trades, separately for cutting losses or locking in gains.
It’s important to keep in mind the right position size, which means the amount you’re willing to lose on a trade. This helps you know when to exit a trade that is not working. It’s also essential to have a strategy and plan in place before entering a trade.
In addition to stop-loss and take-profit orders, traders can implement other risk management techniques such as diversifying their portfolio, maintaining a proper risk-reward ratio, and monitoring their overall portfolio risk.
Take a holistic approach to risk management and utilize chart patterns as a guide. Then you can potentially enhance your chances of success in the fast-paced and volatile world of day trading.
Final Words
In conclusion, day trading patterns can be a valuable tool for identifying potential opportunities in the market and managing risk. I have listed four common day trading patterns and some technical indicators patterns here.
You should always remind that day trading is a high-risk activity. To maximize the potential benefits of day trading patterns, you need to practice and backtest different patterns and strategies. By testing these strategies in paper trading environments, traders can potentially increase their chances of success when implementing them in actual trades. We hope this post has provided a helpful guide for understanding and utilizing day trading patterns.


