In finance, managing risks is essential for long-term success. One critical aspect of risk management is left-tail risk, which can often lead to unexpected financial losses. In this article, we’ll explore the concept of left tail risk, its impact on financial markets, and how you can manage it effectively.
What is Left-Tail Risk?
Simply put, left tail risk refers to the negative impact of rare and unexpected events, such as black swan events. These rare events are specifically related to harmful occurrences, like the 2008 financial crisis or the 2020 Covid-19 pandemic.
They are different from positive, rare occasions. For example, winning a large sum of money is rare, but it is a beneficial event. Thus, it falls under right tail risk rather than left tail risk.
Left-Tail Risk and Normal Distribution

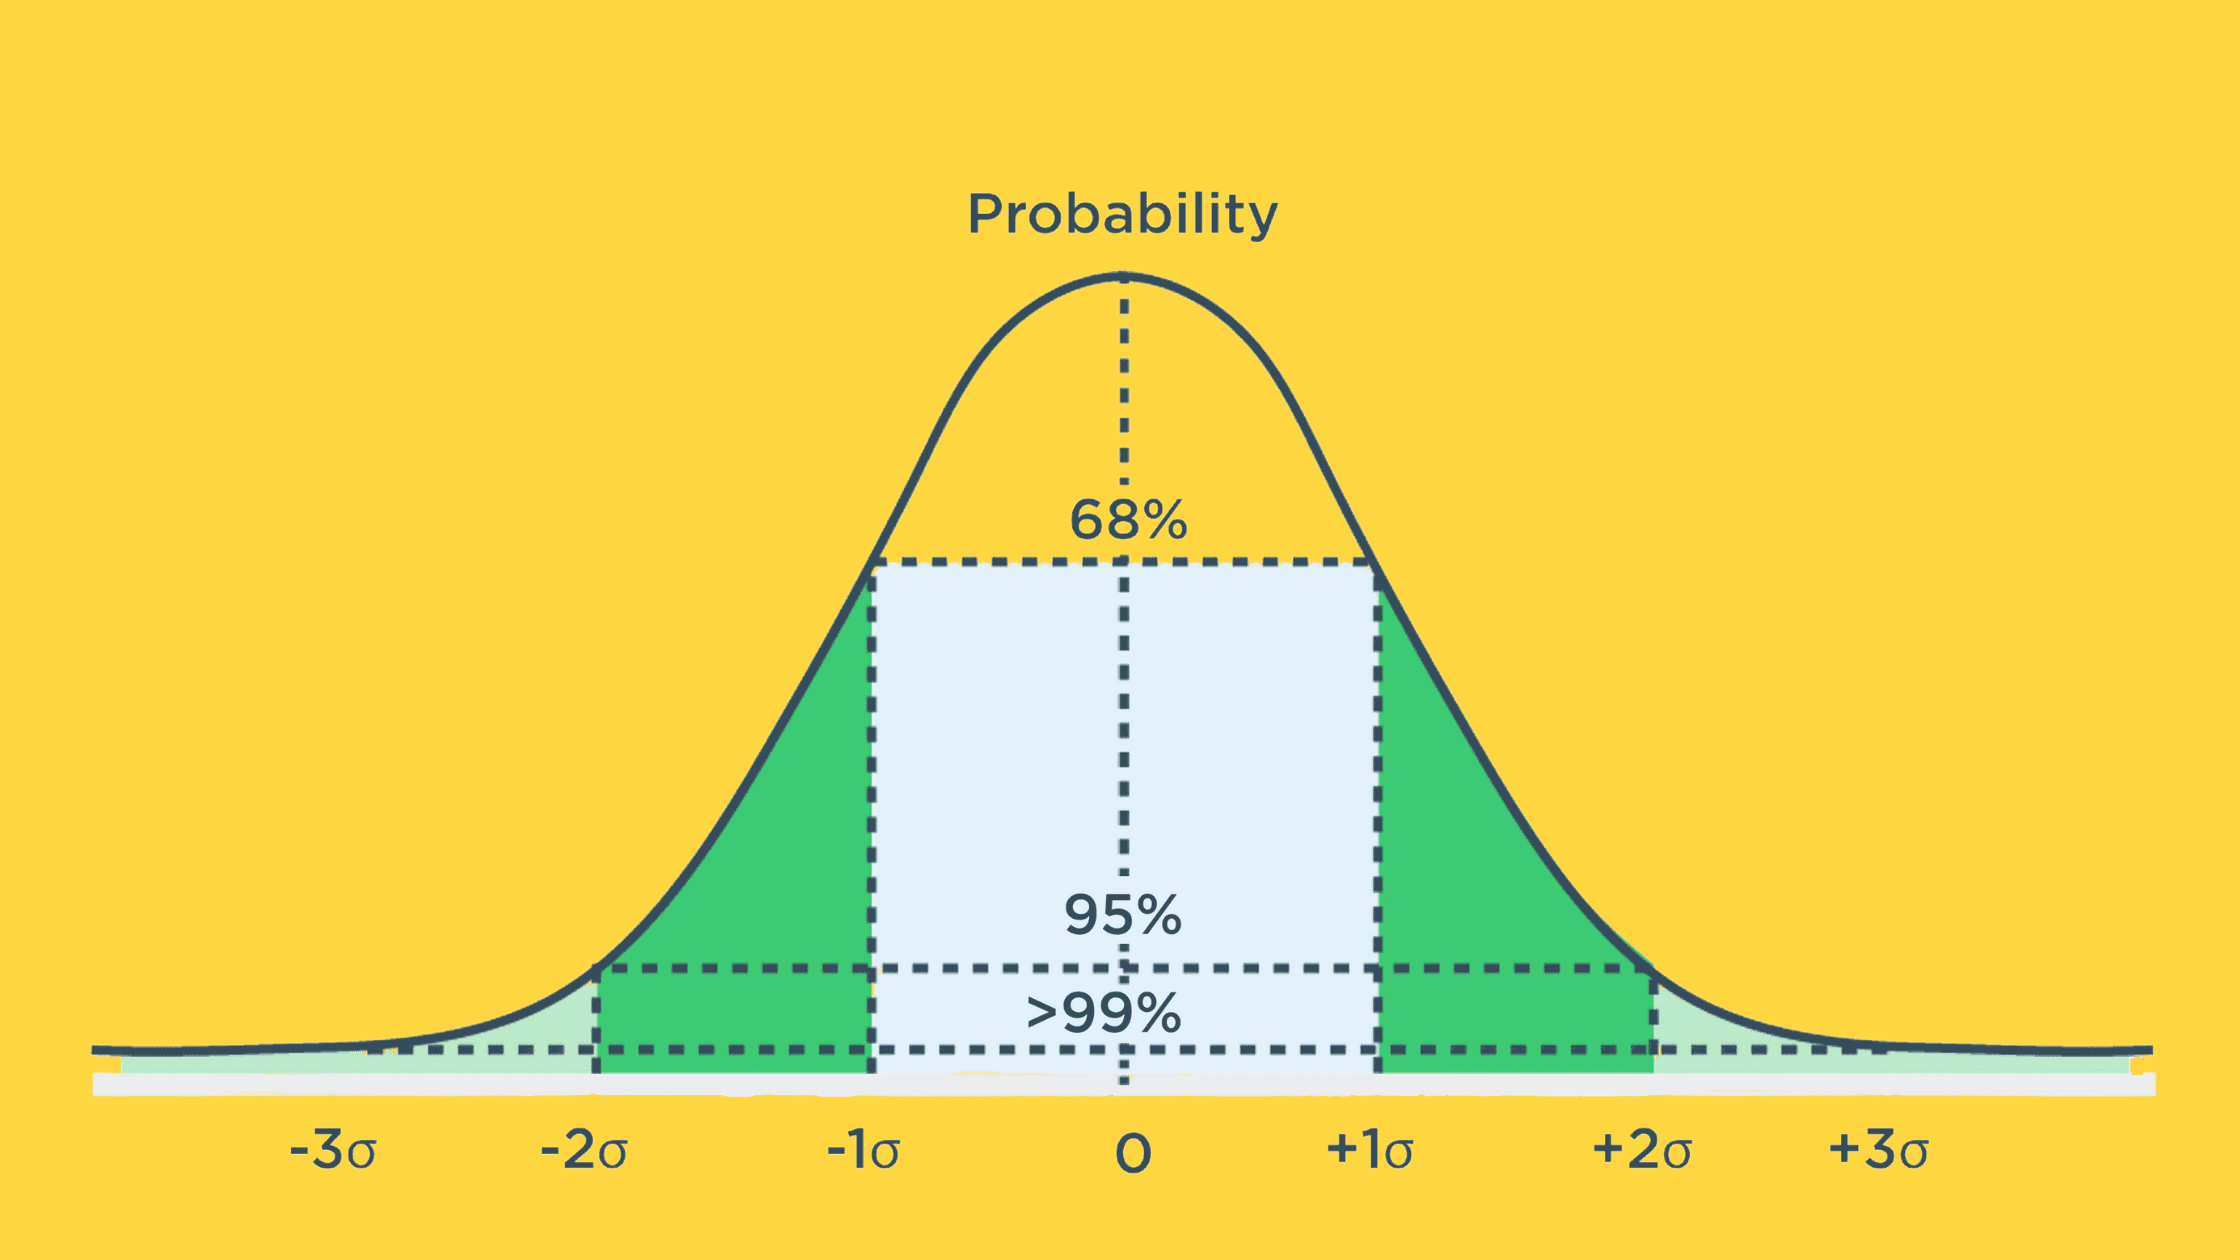
In finance, we often assume that the distribution of events or asset returns follows a normal or Gaussian distribution. This assumption is crucial to many financial models, including Harry Markowitz’s modern portfolio theory (MPT) and the Black-Scholes-Merton option pricing model. Based on this assumption, the probability of returns fluctuating between the mean and three standard deviations (positive or negative) is approximately 99.7%. This means the likelihood of returns moving beyond three standard deviations from the mean is only 0.3%.
However, in reality, extreme negative events or significant losses occur more frequently than we expect. When illustrated on a probability distribution curve, this appears as a fatter tail.
Alternative Distributions

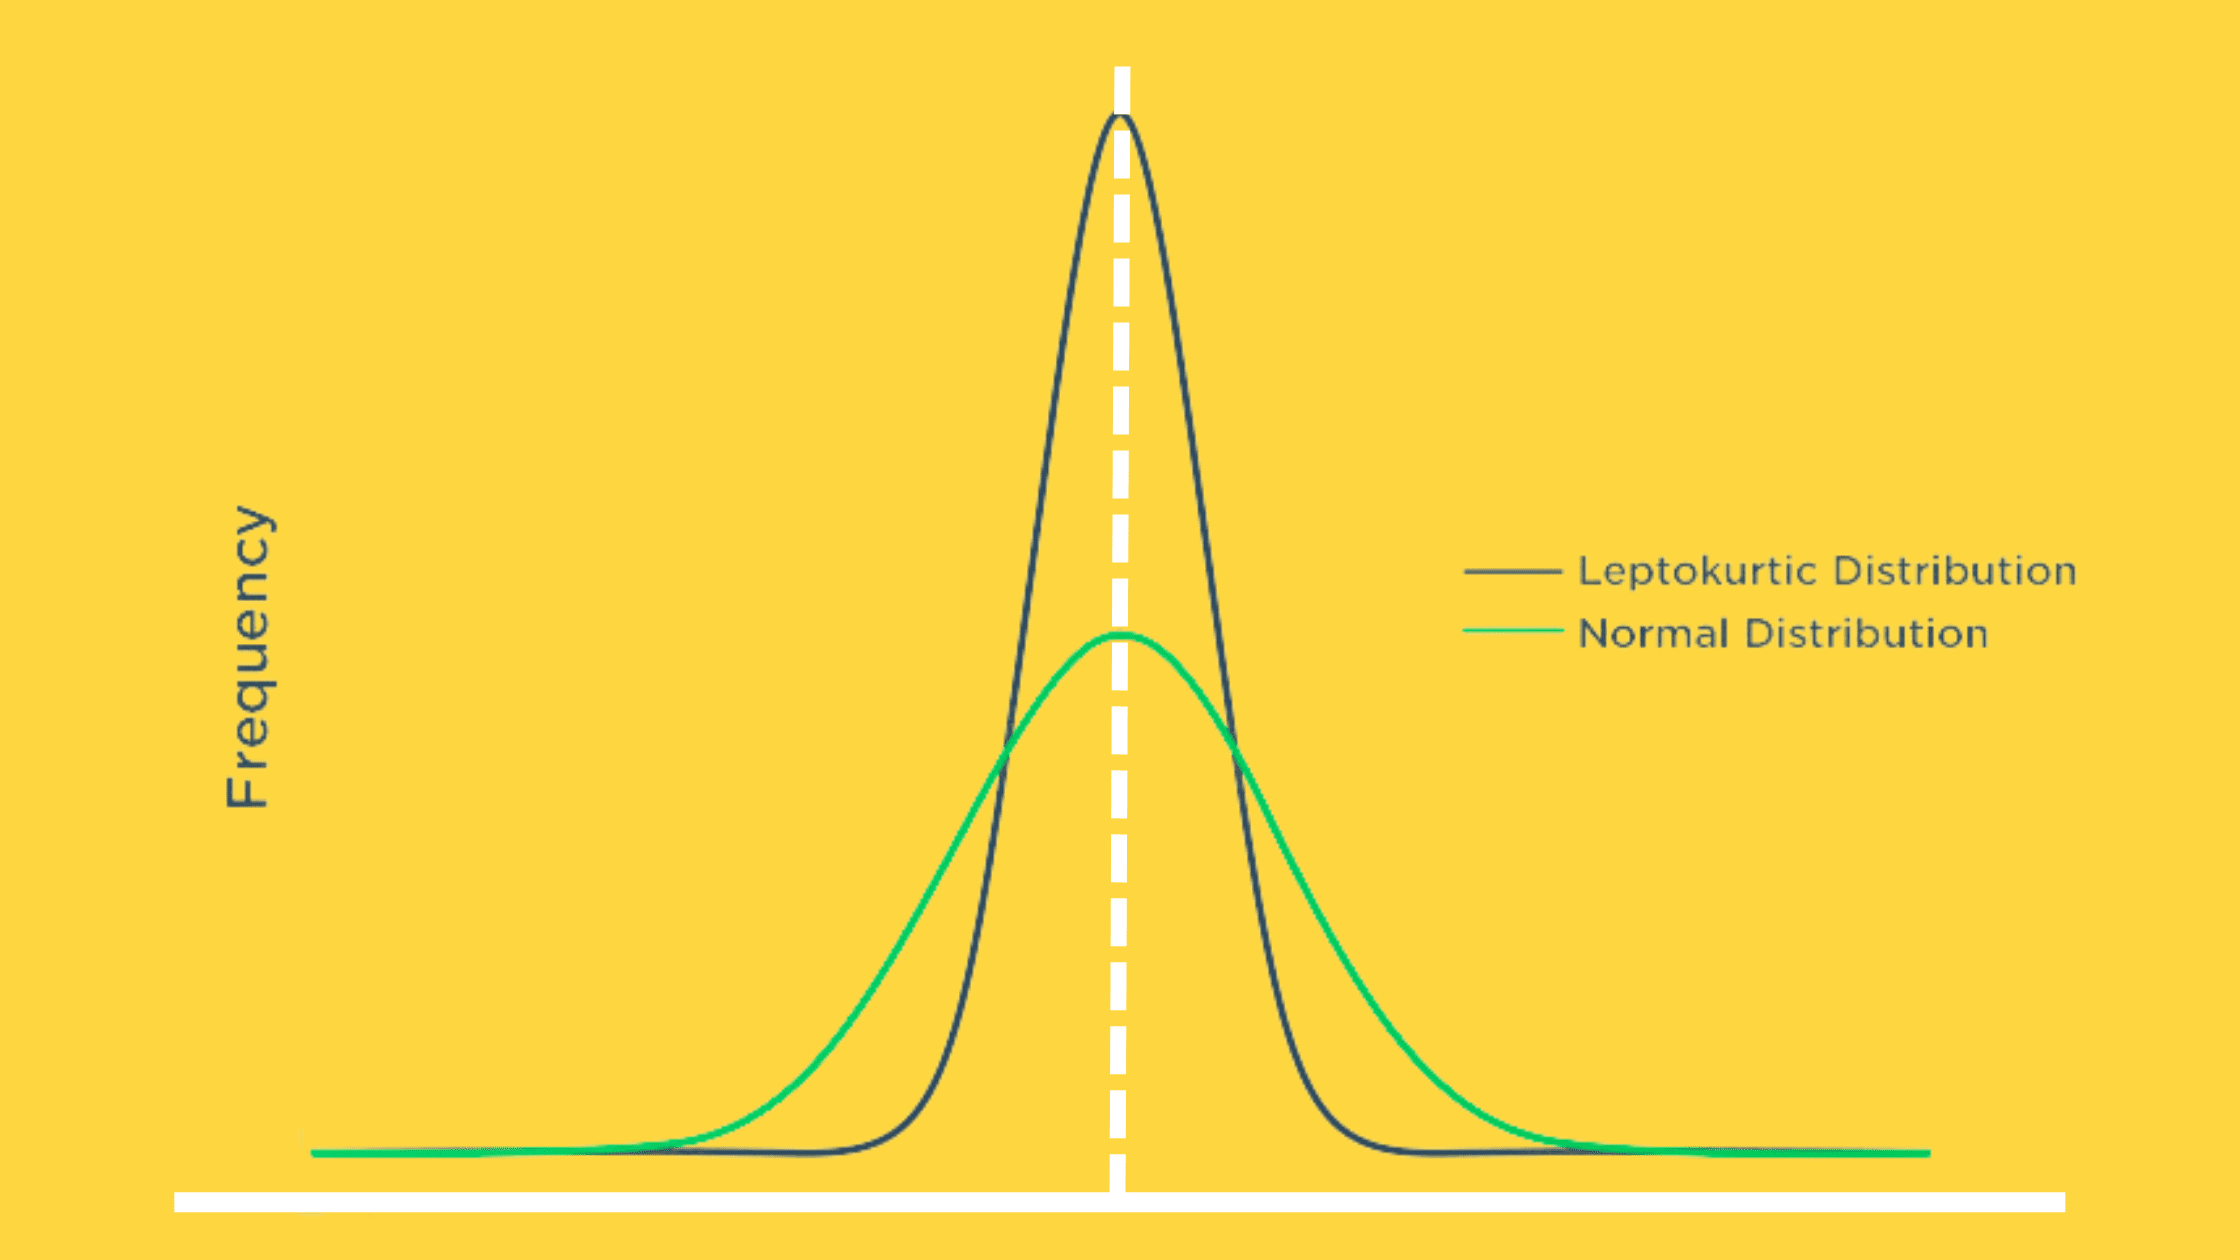
To tackle the challenge of normal distribution not fitting well with left-tail risk, people frequently use leptokurtic distributions to represent asset returns. Leptokurtic distributions, commonly known as fat-tailed distributions, suggest that extreme outcomes happen more often than anticipated. As a result, securities that follow these alternative fat-tailed distributions, like the Student’s t-distribution, have witnessed returns exceeding three standard deviations beyond the mean in over 0.3% of observed outcomes.
By considering these alternative distributions, you can craft more effective risk management strategies and evaluate the increased likelihood of extreme events.
Quantifying Left-Tail Risk
Skewness and Kurtosis

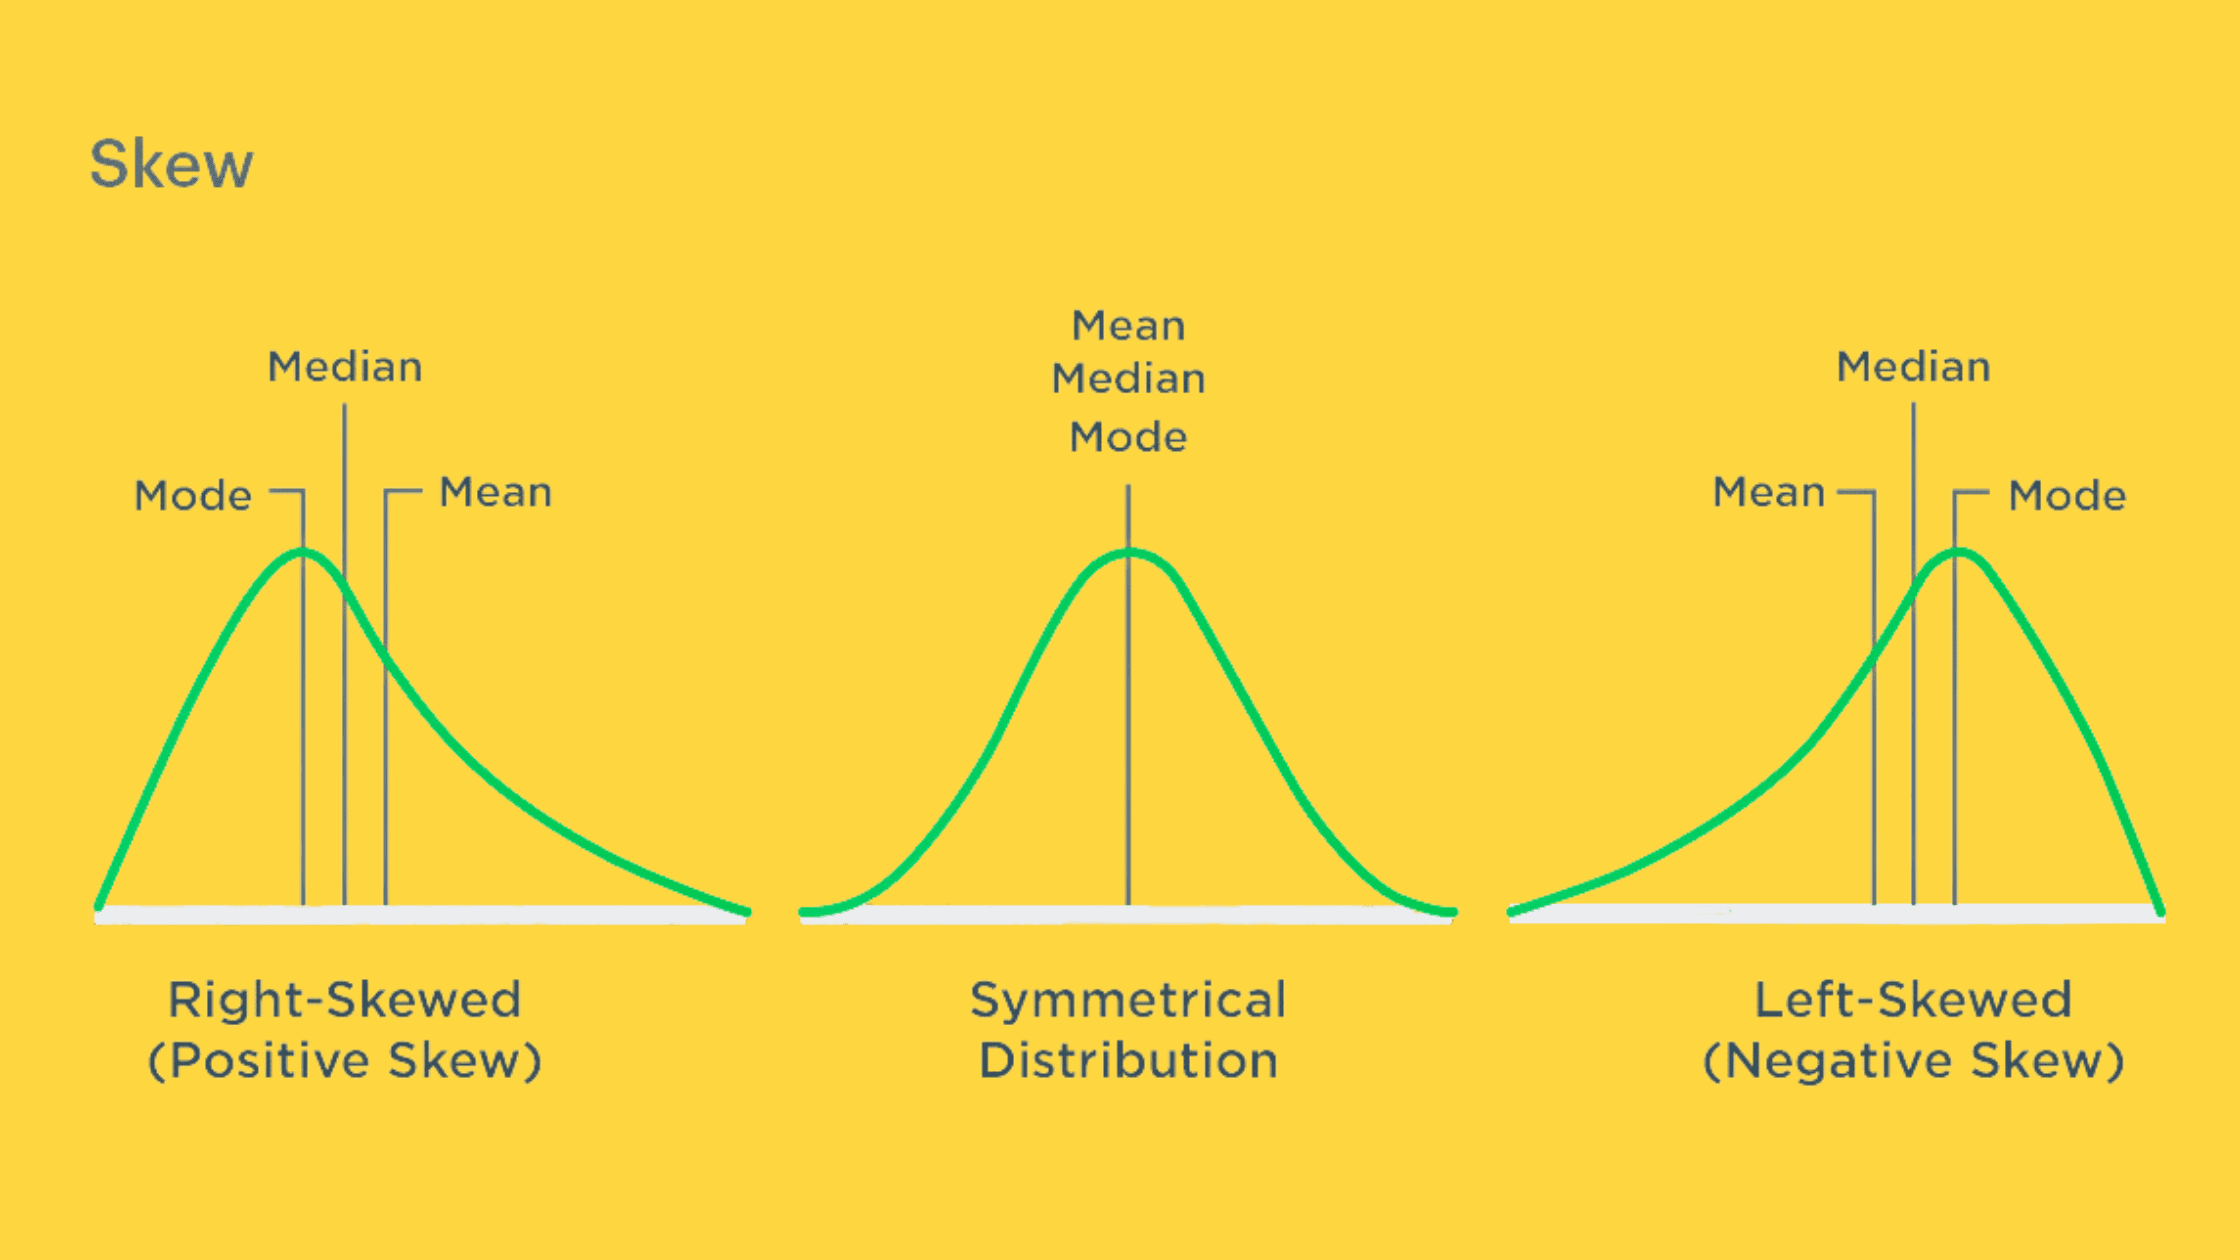
We can use two statistical measures to identify left tail risk: skewness and kurtosis. Skewness measures the asymmetry of a distribution. A perfectly symmetrical distribution has a skewness of 0, while a negatively skewed distribution has a value less than 0, indicating a higher probability of extreme negative returns.
Kurtosis evaluates the tail heaviness of a distribution. A normal distribution has a kurtosis value of 3. Suppose the kurtosis value is greater than 3. In that case, it suggests that the tails of the distribution are more extreme than those of a normal distribution, indicating a greater likelihood of extreme events.
Value-at-Risk (VaR) and its Limitations
Value-at-Risk (VaR) estimates the maximum potential loss for a portfolio over a specific time horizon at a given confidence level (e.g., 95% or 99%). For example, a 95% one-month VaR of $1 million means we have 95% confidence that the portfolio will not lose more than $1 million in a month. However, VaR has its drawbacks: it doesn’t capture tail risk beyond the specified confidence level. This limitation has led to the development of other risk measures like Expected Shortfall (ES).
Conditional Value-at-Risk (CVaR) or Expected Shortfall (ES)
Conditional Value-at-Risk (CVaR), also known as Expected Shortfall (ES), calculates the average loss in the tail of the distribution beyond the VaR threshold. For example, if the 99% VaR is $1 million, the 99% CVaR would quantify the average loss in the worst 1% of scenarios.
Compared to VaR, CVaR provides a more comprehensive understanding of potential extreme losses. It takes into account the severity of losses in the tail, which is particularly useful for non-normal distributions.
Stress Testing and Scenario Analysis
Stress testing and scenario analysis evaluate a portfolio’s resilience in extreme market conditions. By simulating various adverse scenarios, such as a sudden 30% drop in equity markets or a 200 basis point increase in interest rates, you can assess how your portfolio would perform under different circumstances. This helps identify potential vulnerabilities and provides insights into taking appropriate measures to mitigate left tail risk.
Managing Left-Tail Risk
Diversification
Diversification is a fundamental approach to managing left-tail risk. Investing in a range of assets with low correlations can lessen the impact of extreme negative events on your portfolio.
A perfect example occurred during the 2020 Covid-19 outbreak when U.S. stocks saw significant declines and circuit breakers were activated. In contrast, U.S. Treasury bond prices rose considerably during this period. If you had a portfolio mix of 40% stocks and 60% bonds, you would have felt a lower impact from left-tail risk, as the bond price increase helped counterbalance stock losses.
Hedging Strategies
Hedging strategies help reduce potential losses in a portfolio by using financial instruments like options or futures contracts, or by investing in highly negatively correlated assets.
A popular method is the Protective Put strategy. If you hold a long position in an asset, such as stocks, you can simultaneously buy put options on the same asset or a related index.
For instance, if you have a long position in an S&P 500 ETF like the SPDR S&P 500 ETF Trust (SPY), you can buy put options on the same ETF to guard against potential market downturns. If the S&P 500 takes a significant hit, the value of the put options will increase, offsetting the losses in the long position.
Another way to hedge is purchasing a VIX-related ETF, like the iPath S&P 500 VIX Short-Term Futures ETN (VXX). The VIX, often called the “fear index,” usually spikes during extreme negative market events, helping counterbalance SPY losses.
However, due to the nature of the VIX futures curve, VIX ETF positions tend to decay over time. As this decay happens, the ETFs have less money to roll into new futures contracts when the current ones expire. This process repeats over time, leading most VIX ETFs to lose money in the long run.
Thus, hedging strategies generally come with costs, such as paying options premiums or experiencing long-term losses with VIX ETFs. Despite this, they can provide valuable protection from left-tail risk during extreme events.


