Implied Volatility (IV) holds significant importance in options trading. It embodies the market’s expectations regarding an asset’s future price fluctuations, directly influencing the option’s premium. Two prevalent indicators are utilized to measure implied volatility in relation to its historical levels: the IV Rank (Implied Volatility Rank) and IV Percentile (Implied Volatility Percentile).
In this insightful blog post, we will delve into these two indicators, examining their similarities and differences and comparing their application performance.
What is Implied Volatility Rank (IV Rank)?
a. The Concept of IV Rank
The core principle behind Implied Volatility Rank (IV Rank) is to compare the current implied volatility with the highest and lowest implied volatilities during a specified period.
b. The Calculation of IV Rank
The IV Rank calculation can be expressed with this formula:
IV Rank = (Current Implied Volatility – Lowest Implied Volatility) / (Highest Implied Volatility – Lowest Implied Volatility)
By using this formula, we arrive at a value ranging between 0 and 1. This value signifies the relative position of the current implied volatility within its historical spectrum.
c. The Practical Application of IV Rank with an Example
Let’s consider a stock with implied volatility fluctuating between 20% and 40% over the past 12 months. Given that the current implied volatility is 30%, we can compute the IV Rank as follows:
IV Rank = (30% – 20%) / (40% – 20%) = 0.5
This result indicates that the current implied volatility occupies the midpoint of the implied volatility range documented within the past 12 months.
What is Implied Volatility Percentile (IV Percentile)?
a. The Concept of IV Percentile
Implied Volatility Percentile (IV Percentile) quantifies the proportion of historical implied volatility levels outperformed by the current implied volatility within a specified time frame. Contrasting with IV Rank, IV Percentile considers the distribution of past implied volatilities, thus offering a more precise representation.
b. The Calculation of IV Percentile
The IV Percentile calculation can be expressed with this formula:
IV Percentile = (Number of days with IV below the current IV level) / (Total number of days in the period)
c. The Practical Application of IV Percentile with an Example
Let’s assume we assess the implied volatility of a stock for each trading day over the past 12 months and discover that the current implied volatility is 30%. In these 12 months, 75% of the days exhibit implied volatilities below 30%. Thus, the current implied volatility outperforms the implied volatility levels of 75% of the days within the past year. Consequently, the stock’s IV Percentile is 75.
IV Rank vs IV Percentile: Which One is Better?
The crucial distinction between IV Rank and IV Percentile stems from their sensitivity toward outliers present in historical implied volatility data. In scenarios where the historical implied volatility data showcases a relatively normal distribution without significant outliers, both IV Rank and IV Percentile can offer valuable insights. However, suppose the historical data includes extreme values that may not accurately depict the current market environment. In that case, IV Percentile may be a more suitable choice, as outliers influence it less.
IV Rank vs IV Percentile: A Comparative Example Showcasing Reliability
Let’s consider two stocks, Stock A and Stock B. Over the past week, both exhibited a similar range of implied volatilities, between 20% and 40%. However, Stock B experienced an extreme implied volatility spike to 80% on one day due to a rare market event.
The implied volatilities for the past week are as follows:
Stock A: [20%, 25%, 30%, 35%, 40%]
Stock B: [20%, 25%, 30%, 80%, 40%]
The current implied volatility for both stocks is 32%.
For Stock A, we can calculate the IV Rank as follows:
IV Rank = (32% – 20%) / (40% – 20%) = 0.6
For Stock B, we can similarly calculate the IV Rank:
IV Rank = (32% – 20%) / (80% – 20%) = 0.2
In this case, IV Rank suggests that the current implied volatility for Stock B is relatively low compared to its historical range. However, this conclusion may be misleading, as the extreme value of 80% distorts the IV Rank calculation.
Now let’s calculate the IV Percentile. For Stock A, the current implied volatility of 32% is higher than 60% of the historical values. For Stock B, the current implied volatility of 32% is also higher than 60% of the historical values.
IV Percentile for Stock A: 60
IV Percentile for Stock B: 60
Here, IV Percentile offers a more accurate reflection of the current market conditions for Stock B, as the extreme value of 80% less influences it. In this example, we demonstrate that relying on IV Percentile would sometimes lead to more informed decisions.
Final Thoughts
From the analysis presented, it becomes clear that IV Percentile is a more reliable indicator than IV Rank. It’s crucial not to overlook the possibility of extreme values, as significant events or data releases can readily give rise to such occurrences. Even relatively stable stock indices may be subject to extreme values.
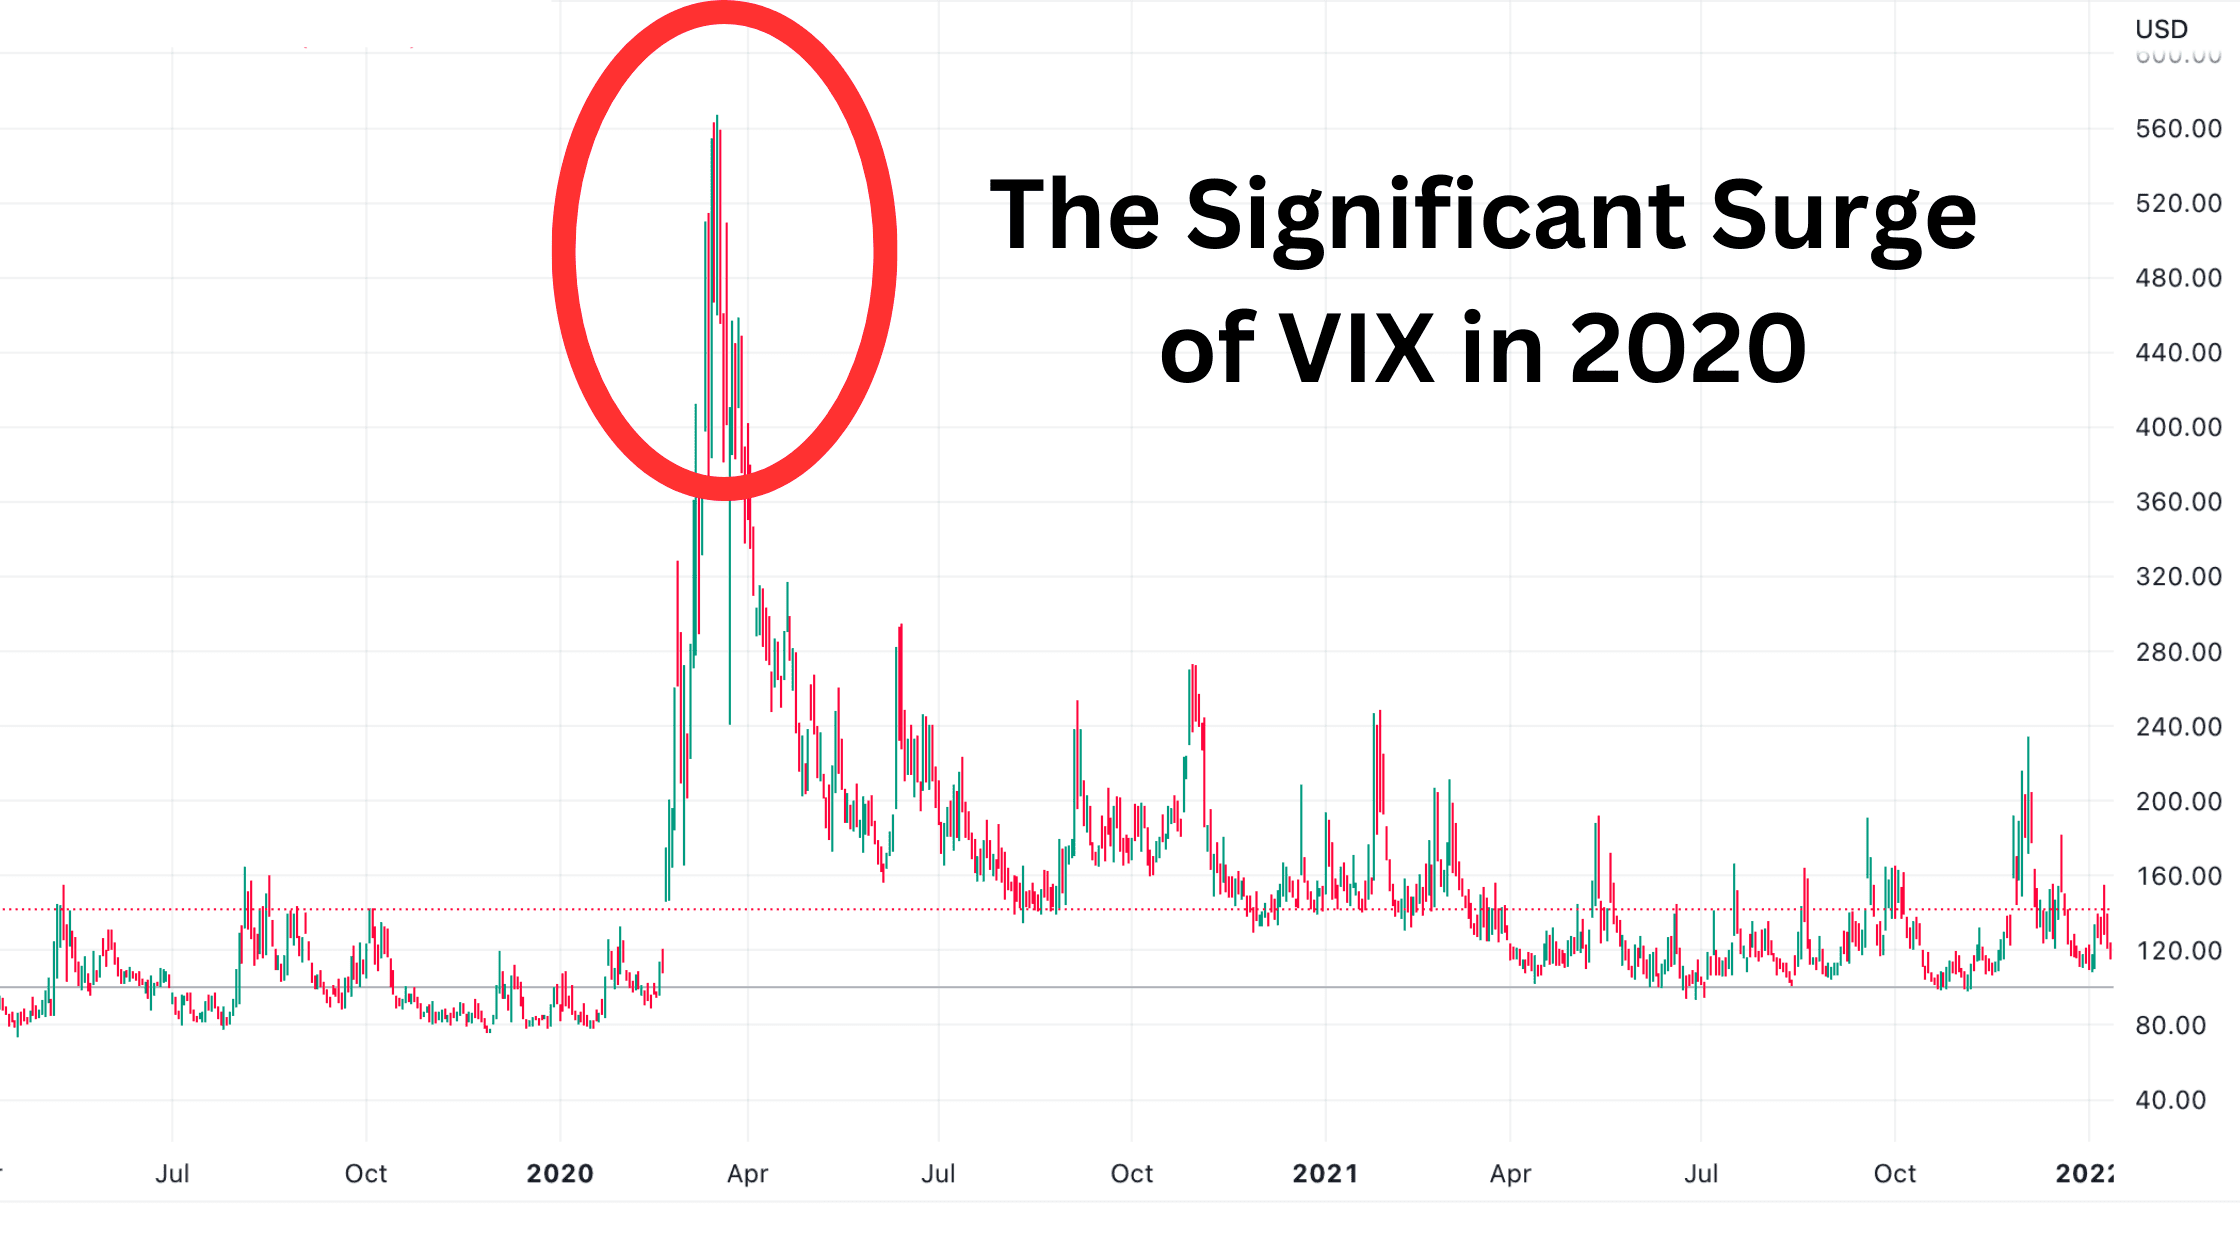
For instance, the VIX—an indicator reflecting the implied volatility of the S&P 500 index—experienced a dramatic surge in 2020 due to the Covid-19 pandemic. If the time frame for measuring IV Rank encompasses this period, it could considerably underestimate the actual relative size of implied volatility. By employing IV Percentile, this issue can be mitigated as much as possible.


